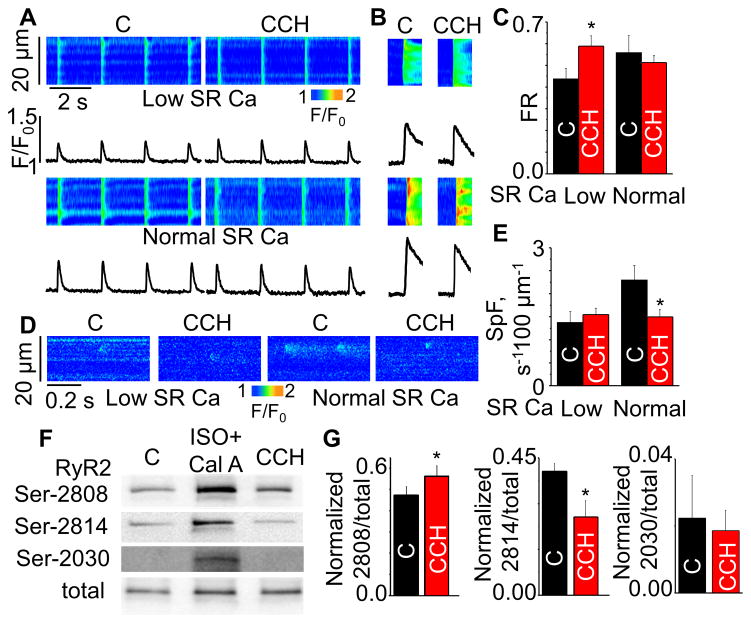
Fig. 2. Effects of CCH on Ca handling at different SR Ca contents and RyR2 phosphorylation in WT mouse ventricular myocytes.
Representative line-scan images for (A) Ca transients, (B) SR Ca content and (D) Ca sparks at normal and low (60% of normal) SR Ca loads with or without 10 μmol/L CCH. (C,E) Summary data for fractional release (FR) and spark frequency (SpF) at different SR Ca contents (±SEM, n=4–23). *P<0.05 vs control (C). (F,G) Immunoblots and bar graphs for the effects of CCH on phosphorylation of RyR2 (±SEM, n=4–18). *P<0.05, paired t-test. Cal A (Calyculin A) + ISO produces maximum phosphorylation. SR Ca content was obtained by application of 20 mmol/L caffeine.

