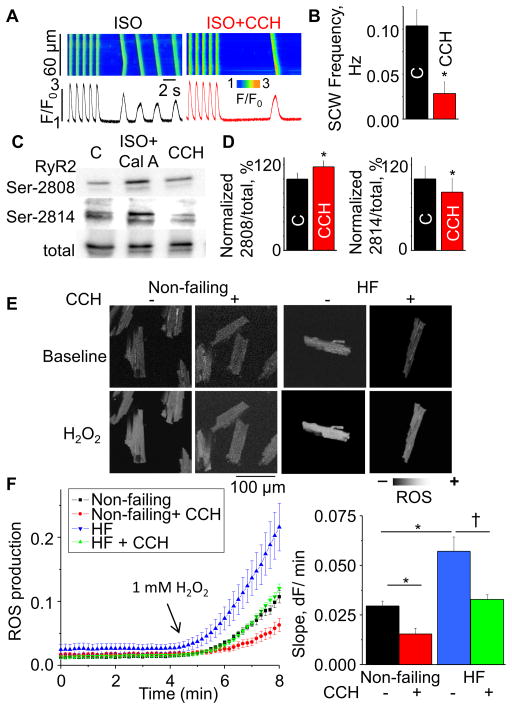
Fig. 5. Effects of CCH on Ca handling, RyR2 phosphorylation and ROS production in HF canine myocytes.
Confocal Ca recordings (A) before and after application of CCH in the presence of 10 nmol/L ISO in field-stimulated failing cells (2Hz). (B) Summary bar graph for spontaneous Ca wave frequency (SCW) (±SEM, n=21–25). *P<0.05 vs control. Immunoblots (C) and pooled data (D) showing effect of CCH on RyR2 phosphorylation (±SEM, n=3). *P<0.05, paired t-test. (E) Representative images of ROS generation measured by using the ROS-sensitive dye, CM-H2DCFDA, for non-failing and failing myocytes under baseline condition and in the presence of 1 mmol/L H2O2. (F, left) Averaged traces of ROS production from each group. (F, right) Pooled data for ROS accumulation rates obtained from the slopes in the presence of 1 mmol/L H2O2 (±SEM, n=5–8). Data pointes were normalized to maximum fluorescence signal produced by 10 mmol/L H2O2. * P < 0.05 vs non-failing control. †P < 0.05 vs failing control.

