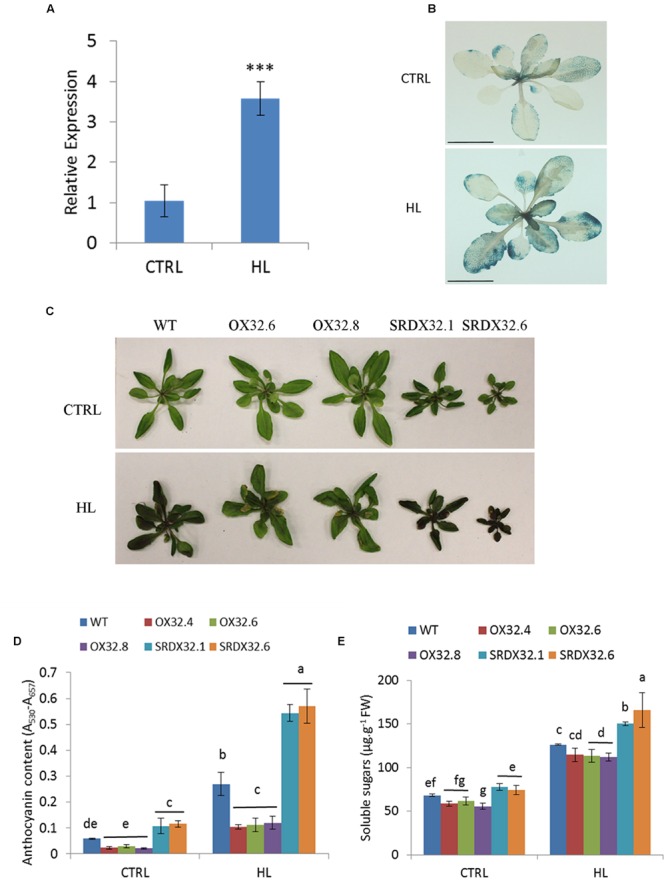
FIGURE 2.

Regulation of high light-induced anthocyanin biosynthesis. (A) Expression analysis of ANAC032 in response to high light stress using qRT-PCR assay. Data represent mean values (±SD). ACT7 was used as internal control. Data were analyzed statistically using Student’s t-test (∗∗∗P < 0.01). (B) β-glucuronidase activity of PANAC032: GUS line in response to high light treatment. Twenty-day-old plants of PANAC032 : GUS line were transferred to control/optimal (150 μmol m-2 s-1) and high light (∼1000 μmol m-2 s-1) for 24 h and then incubated in GUS-staining solution overnight (scale bar = 1 cm). (C) Phenotype of WT and ANAC032 transgenic lines grown under optimal (control) and high light. (D) Biochemical analysis of anthocyanin content in WT and ANAC032 transgenic lines in response to high light stress. (E) Analysis of total soluble sugars in response to HL stress. 17-day-old plants of WT and ANAC032 overexpression and SRDX lines were grown under high light (∼450 μmol m-2 s-1) for 4 days. Plants grown under optimal light conditions (∼150 μmol m-2 s-1) were considered as control. Data represent values from three biological replicates. Bars with different letters are not statistically similar to each other according to one way ANOVA LSD test (P < 0.05).
