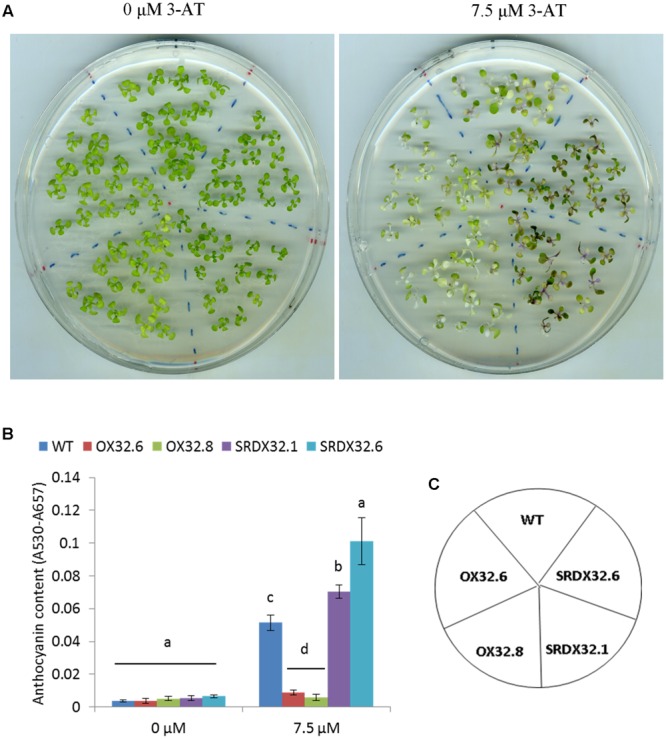
FIGURE 3.

Effect of 3-AT on anthocyanin biosynthesis in WT and ANAC032 transgenic lines. (A) Phenotypic response of WT and ANAC032 overexpression and SRDX lines for anthocyanin biosynthesis in response to 3-AT treatment after 17 days of growth under long-day conditions. (B) Biochemical analysis of anthocyanin content in WT and ANAC032 transgenic lines after 17 days on 0 and 7.5 μM of 3-AT. (C) Template showing the position of the genotypes shown in (A). Data represent mean values from three biological replicates. Within each treatment, bars with different letters are not statistically similar to each other according to one way ANOVA LSD test (P < 0.05).
