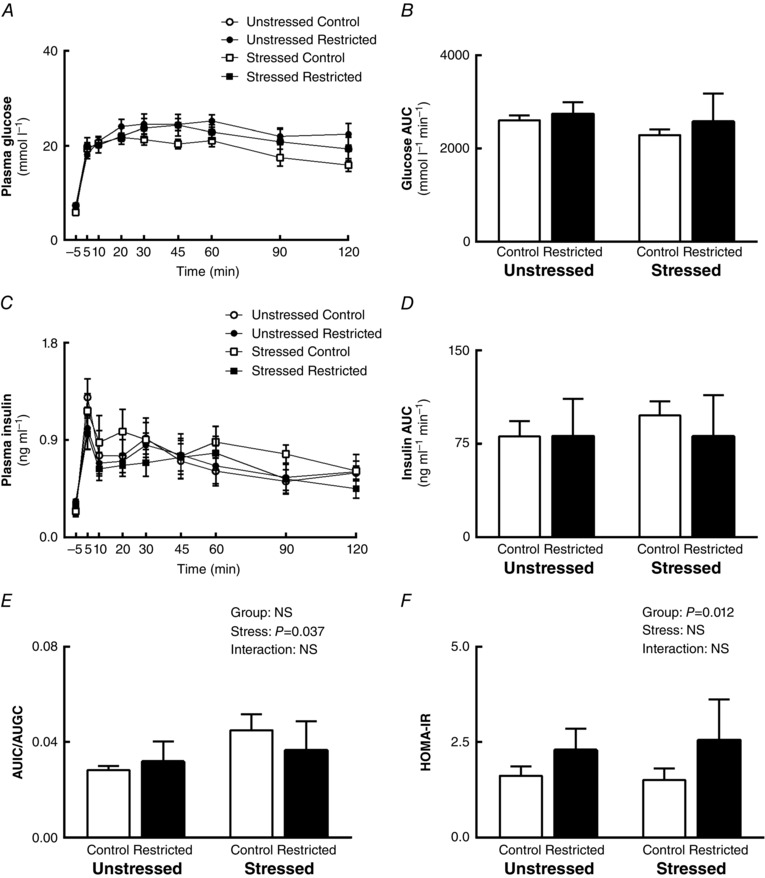
Figure 2. Plasma glucose and insulin response during IPGTT .

Effects of growth restriction and maternal stress on: A, plasma glucose concentration over 120 min; B, area under glucose curve; C, plasma insulin concentration over 120 min; D, area under insulin curve; E, ratio of area under insulin curve to area under glucose curve; and F, HOMA‐IR during IPGTT (mean ± SEM; n = 6–7 per group).
