
Figure 3. Renal function .
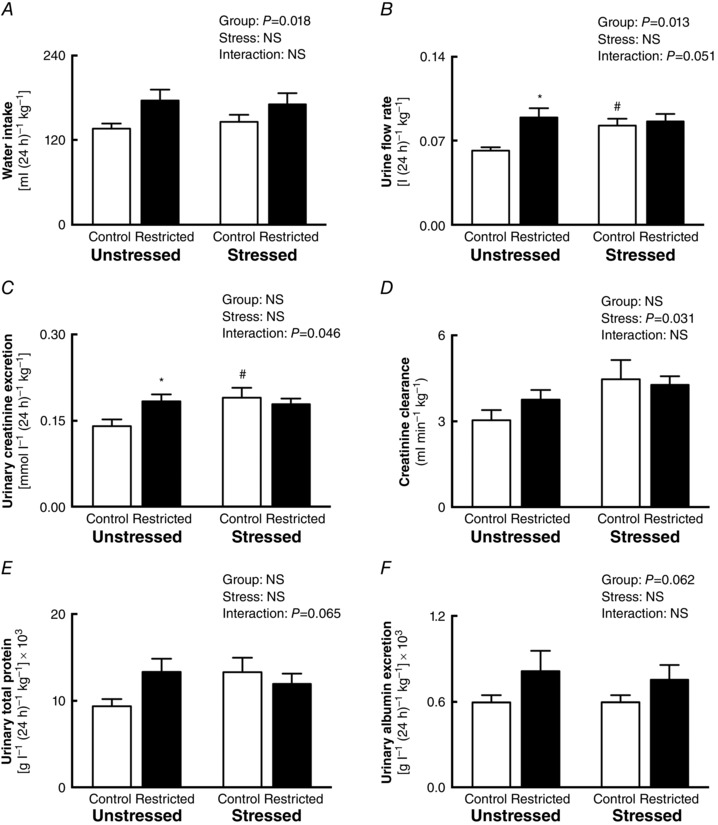
Effects of growth restriction and maternal stress on: A, water intake; B, urinary flow rate; C, urinary creatinine excretion; D, creatinine clearance; E, urinary micro‐total protein excretion; and F, urinary albumin excretion over 24 h (mean ± SEM; n = 8–14 per group). * P < 0.05 vs. Control counterpart (following significant interaction); # P < 0.05 vs. Unstressed counterpart (following significant interaction).