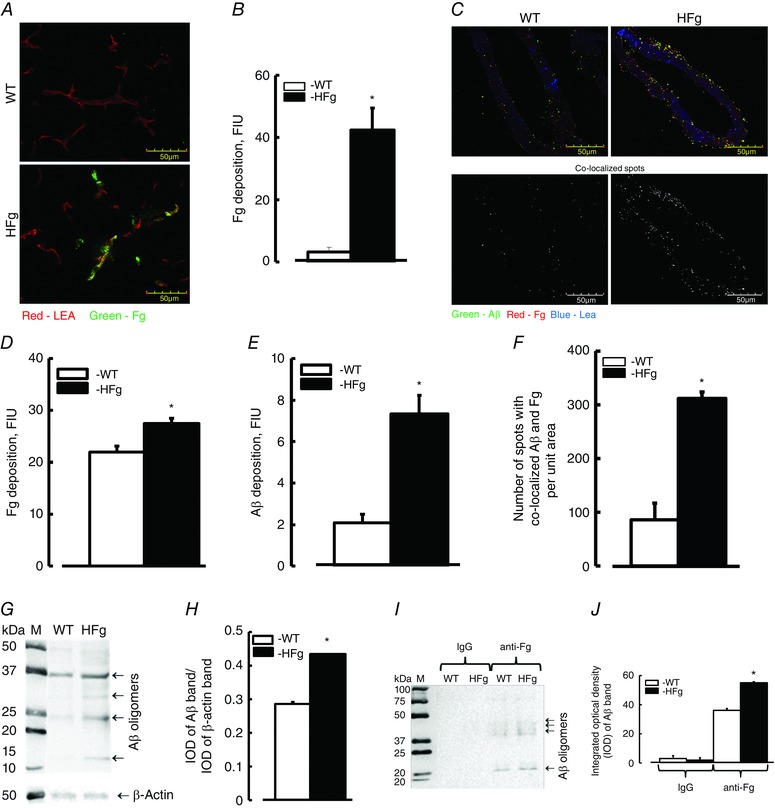
Figure 4. Hyperfibrinogenaemia‐induced increased deposition of fibrinogen and amyloid β in mouse brain vessels .

A, examples of images showing fibrinogen (Fg, green) deposition in brain vessels (labelled with LEA and shown in red) in samples obtained from WT and HFg mice. B, summary of Fg fluorescence intensity levels presented as fluorescence intensity units (FIU). C, examples of images showing expression of Fg (shown as red dots) and amyloid β (Aβ, shown as green dots), and their co‐localization (shown in yellow) in brain vessels of WT and HFg mice (upper row). Images in the lower row show results of co‐localized spots identified after deconvolution of respective upper images by Image‐Pro Plus. Summaries of fluorescence intensities of Fg (D) and Aβ (E) are presented as FIU. F, number of co‐localized Fg and Aβ spots are presented. G, example of WB analysis for content of Aβ in brain samples from WT and HFg mice. H, summary of ratios of integrated optical density (IOD) of Aβ bands to IOD of the respective β‐actin bands. I, example of IgG‐ and anti‐Fg antibody‐precipitated brain proteins from WT and HFg mice tested for presence of Aβ. Note: IgG was used as a negative control. J, summary of IOD of Aβ bands in lanes. * P < 0.05 vs. WT, n = 8 (IHC) and n = 5 (WB and Co‐IP). [Colour figure can be viewed at wileyonlinelibrary.com]
