
Figure 2. Pump cycle of an isolated, cannulated (2‐valve) lymphangion from rat mesentery when Pout is elevated ramp‐wise while Pin is held constant .
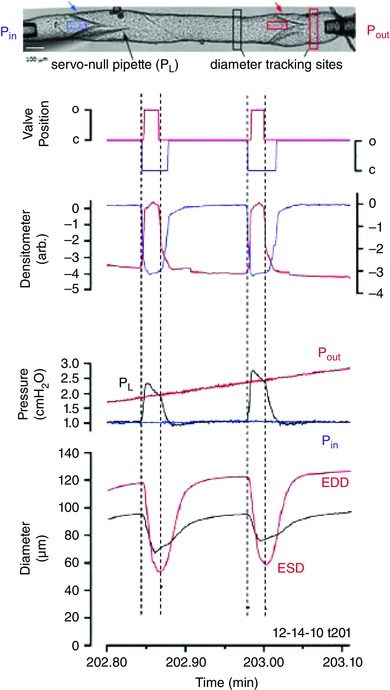
Normal direction of flow is left to right. Red and black diameter traces correspond to red and black tracking windows on each side of the output valve in the video image at the top. Blue and red densitometer traces correspond to blue and red densitometer windows positioned just upstream of the input and output valves, respectively. Valve position traces represent the binary state of each valve based on thresholding of the respective densitometer traces. Black pressure trace is the intraluminal pressure (between the valves) measured by a sharp servo‐nulling pipette advanced through (and sealed into) the wall. Modified from Davis et al. (2011).