
Figure 3. Effect of elevating preload independently of afterload on the contractile function of an ex vivo mesenteric lymphangion from rat .
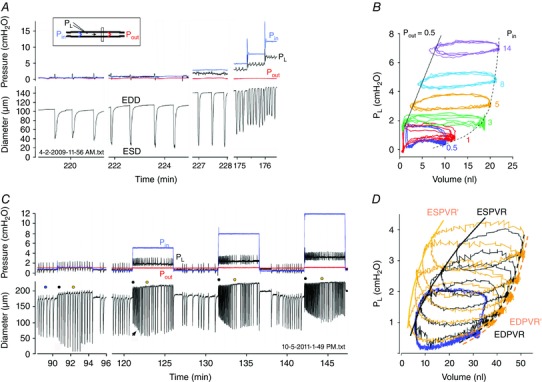
A, P in was elevated to various levels while P out was held constant. Pipette resistances were purposely kept to relatively high values to limit the inhibitory effect of forward flow produced by P in > P out gradient. Inset shows diagram of pressure and diameter measurement sites. B, pressure–volume loop constructed from a portion of the data in A, showing the curvilinear P–V relationship for EDD (dashed line) and linear P–V relationship for ESD. C, time course of spontaneous contraction AMP and FREQ changes after a series of step elevations in P in (P out held constant). After each step, AMP falls but then recovers (or gets even larger) over the course of ∼1 min (arrow). Also, a burst of high FREQ contractions occurs, with FREQ subsequently slowing slightly. D, P–V plot of some of the data in C; blue traces represent data from 3 contraction cycles prior to the P in steps (corresponding to time indicated by blue dot in C), black and gold traces represent single contraction cycles corresponding to the black and gold dots in C, immediately after the pressure step (black dots in C) or ∼1 min later (gold dots in C). The shift in the end‐systolic P–V relationship (ESPVR) with time after P in elevation, with unchanged end‐diastolic (ED)PVR reflects an increase in contractility. Modified from Scallan et al. (2012 b).