
Figure 4. Effect of elevating afterload in an ex vivo mesenteric lymphangion from rat .
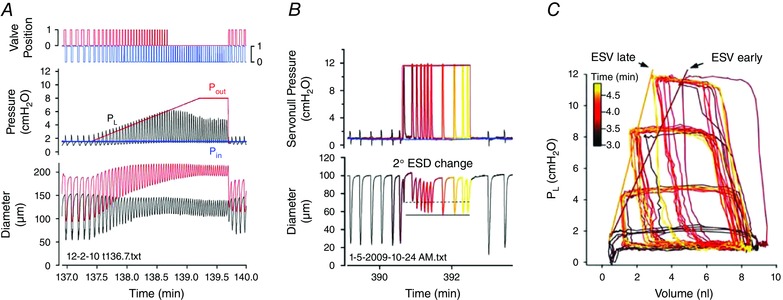
A, ramp‐wise elevation in P out (with P in held constant) leads to a progressive increase in the peak systolic pressure developed in the lumen (P L, black trace). Note also a modest, progressive constriction on the input side of the valve during the pressure ramp. Opening of the output valve (top red trace) is indicative of ejection during systole, until P out reaches ∼6.2 cmH2O, at which point the pump limits (fails). B, response to a step increase in P out. Contraction AMP declines initially but then partially recovers over the next ∼1 min. C, P–V plot of the data in B showing time‐dependent leftward shift in the curves after a P out step (data in B represent the top set of curves). See diagram in Fig. 2 for explanation of pressure, diameter and valve position measurements. ESV, end‐systolic volume. Modified from Davis et al. (2012).