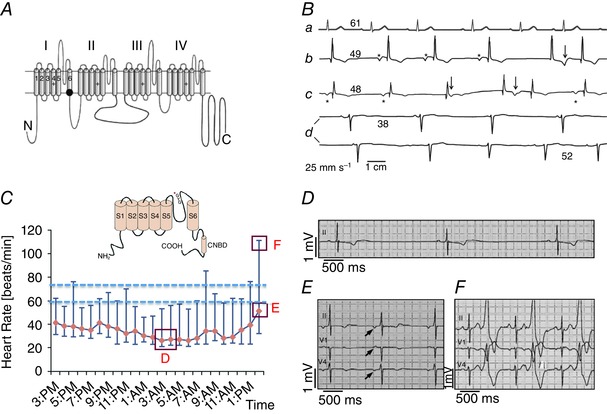
Figure 1. Examples of two congenital dysfunctions of heart automaticity in humans, related to loss‐of‐function in Cav1.3 channels (SANDD; A and B), or familial bradycrdia due to a mutation in the pore sequence of the f‐channel HCN4 (C–F) .

A, schematic transmembrane topology of the α1 subunit of the Cav1.3 Ca2+ channel. The black dot indicates the position of the SANDD mutation. B, sample Holter ECG recordings from individuals with normal heart rate (a), or from SANDD affected subjects, who were homozygous for the mutation (b–d). The number above each ECG baseline indicates the averaged heart rate. Asterisks mark P waves. Arrows identify ECG time points suggesting P waves coincide with T waves. Adapted from Baig et al. (2011), with permission. C, daily Holter heart rate profile of a patient with familial SAN dysfunction due to HCN4 pore mutation. Data points indicate hourly averaged data between the maximum and minimum heart rate of a patients carrying the glycine–tyrosine–glycine (GYG) mutation in the pore motif of HCN4. The inset shows a schematic transmembrane topology of the f‐channel HCN4 subunit. The asterisk indicates the position of the mutation within the motif of the channel pore. Dashed lines indicate the expected basal heart rate interval for normal subjects. Red boxes mark time points corresponding to ECG samples shown in panels D–F. D, a sample recording of SAN bradycardia. E and F, ectopic atrial rhythms and ventricular bigeminisms, respectively. Adapted from Schweizer et al. (2014), with permission.
