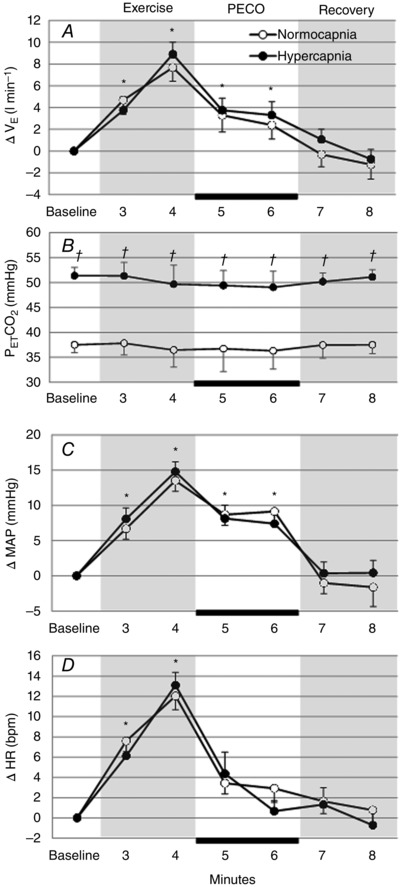
Figure 3. Changes in respiratory and cardiovascular variables during the PECO trials in normocapnic and hypercapnic COPD patients .

Change in , MAP and HR from baseline, and during each minute of the PECO trials in normocapnic and hypercapnic COPD patients. The black bar indicates the period of circulatory occlusion. *Significant difference from baseline value (P < 0.05). †Significant difference between normocapnic and hypercapnic groups.
