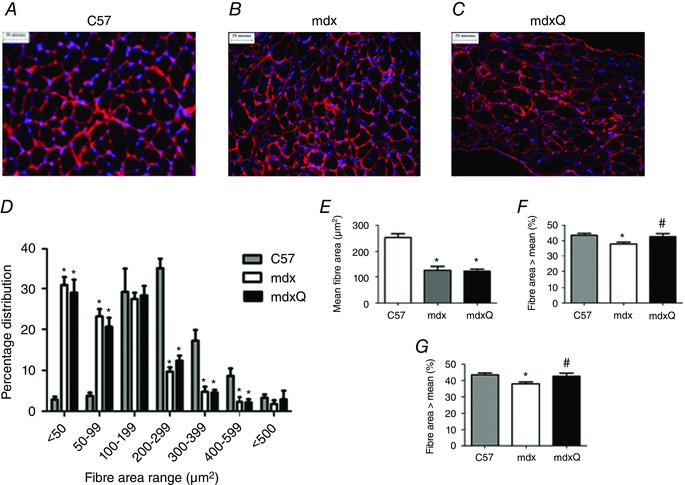
Figure 6. Fibre area distribution is significantly altered by dystrophin deficiency .

A–C, representative images of laminin‐probed diaphragm sections from C57, mdx and mdxQ animals at 14 months of age. D, fibre area distribution was altered by dystrophin deficiency such that there was a greater frequency of smaller fibres at the expense of larger fibres. This outcome resulted in (E) mean fibre size to be decreased in diseased animals independent of quercetin treatment. F, the variability of the fibre area distribution was increased in mdx and mdxQ compared to C57. G, the percentage of fibres with an area higher than the mean was decreased in mdx compared to C57 and was corrected by dietary quercetin enrichment. *Significantly different from C57; #significantly different from mdx. C57 (n = 7), mdx (n = 6), mdxQ (n = 6). [Colour figure can be viewed at wileyonlinelibrary.com]
