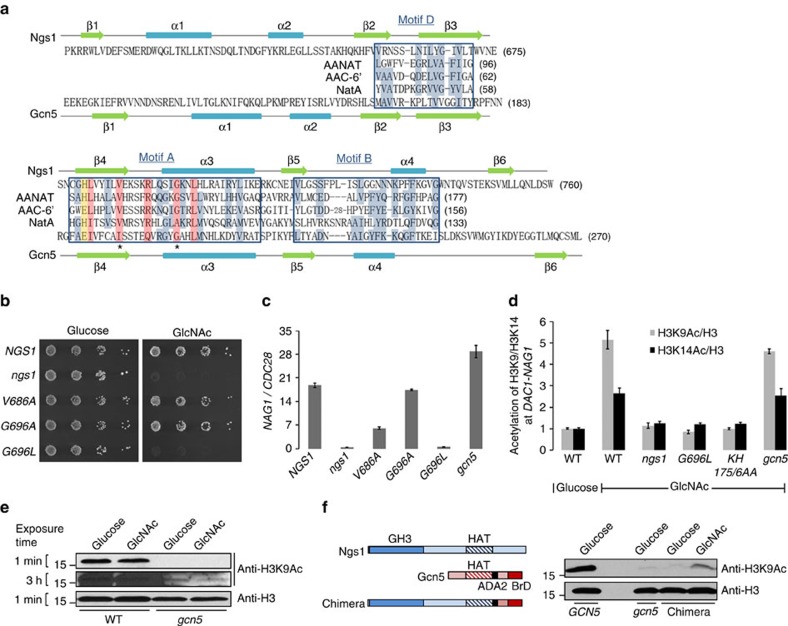
Figure 4. Conserved acetyl-CoA interacting residues of Ngs1 are required for GlcNAc-induced promoter histone acetylation and transcription.
(a) Sequence alignment of GNAT homology motifs A, B, and D in Ngs1 and C. albicans Gcn5 and three GNAT superfamily members (sheep AANAT, arylalkylamine-N-acetyltransferase68; Enterococcus faecium AAC-6′, aminoglycoside 6′-N-acetyltransferase32; S. pombe NatA, N-acetyltransferase complex catalytic subunit57). Consensus residues throughout the superfamily, as determined by Neuwald and Landsman40, are shown with blue shade, and residues particularly conserved in motif A are shaded in pink. The yellow shade indicates the residue known to be critical for HAT catalysis in Tetrahymena Gcn5. The asterisks under the aligned sequences show the location of residues known to interact with the Acetyl-CoA. Secondary structure elements of Ngs1 and Gcn5 from C. albicans are also shown. (b) Dilutions of ngs1 mutant cells carrying NGS1 (HLY4395), ngs1V686A (HLY4406), ngs1G696A (HLY4407), ngs1G696L (HLY4408), or vector alone (HLY4396) were spotted onto the solid YNB media plates containing 2.5 mM GlcNAc or glucose and then incubated at 30 °C for 2 days. (c) NAG1 mRNA levels of the strains from (b) and the gcn5 mutant (CPS50) were determined in GlcNAc-containing medium by qRT-PCR. (d) ChIP with anti-H3, anti-acetylated H3K9, and anti-acetylated H3K14 antibodies in the wild type (SN250), ngs1 mutant cells carrying ngs1G696L (HLY4408), ngs1KH175/6AA (HLY4400) or vector alone (HLY4396), and gcn5 mutant cells carrying vector (CPS50). Cells were grown in GlcNAc or glucose for 30 min for the ChIP experiment. The value from wild type in glucose medium was set to 1.00. (e) Global H3K9 acetylation level is not induced by GlcNAc. Cell lysates of wild type (SN250) and gcn5 mutant (CPS50) growing in GlcNAc or glucose medium were subjected to Western analysis. (f) GlcNAc regulated H3K9 acetylation by the Ngs1-Gcn5 chimera in the gcn5 mutant. The gcn5 revertant and gcn5 mutant carrying the empty vector or chimeric construct were grown overnight in YEP containing 100 mM GlcNAc or glucose at 30 °C to saturation for Western analysis. The construct is schematically illustrated on the left (ADA2, ADA2 interaction domain; BrD, bromodomain). Mean data±s.d. from three independent qPCR experiments was plotted.

