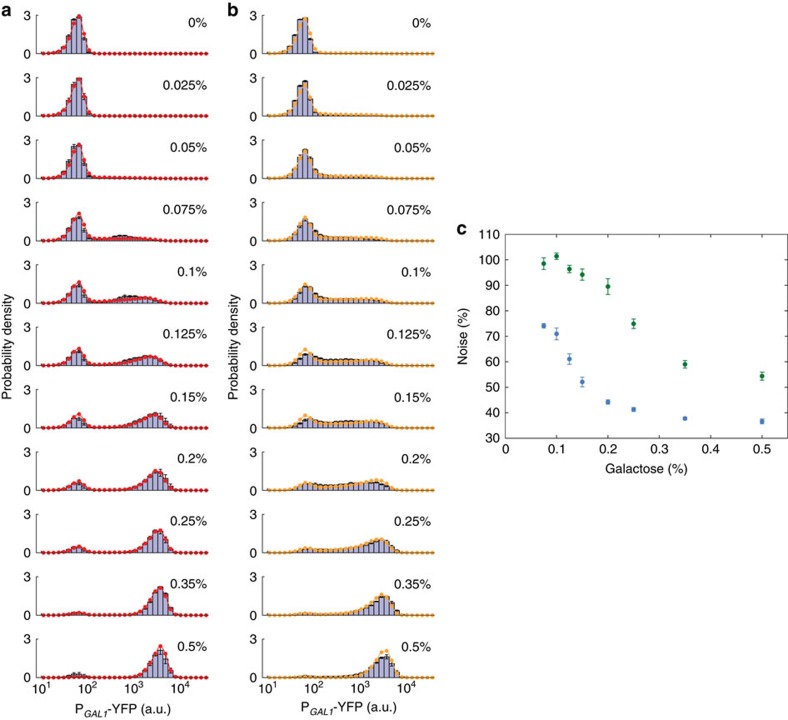
Figure 3. Noise reduction elucidated in haploid background and the model fitting.
(a) Single-cell expression histograms showing the response of the natural (wild type) GAL network in haploid cells (MA0048, bars) at different galactose concentrations along with the fitted model output (red). (b) Single-cell expression histograms showing the response of the synthetic network in haploid cells (WP115, bars) at different galactose concentrations along with the fitted model output (orange). (c) Coefficient of variation for the expression level of ON cells in haploid cells carrying wild type (blue) or synthetic (green) networks at the given galactose concentrations. Error bars indicate s.e.m. (N=4).

