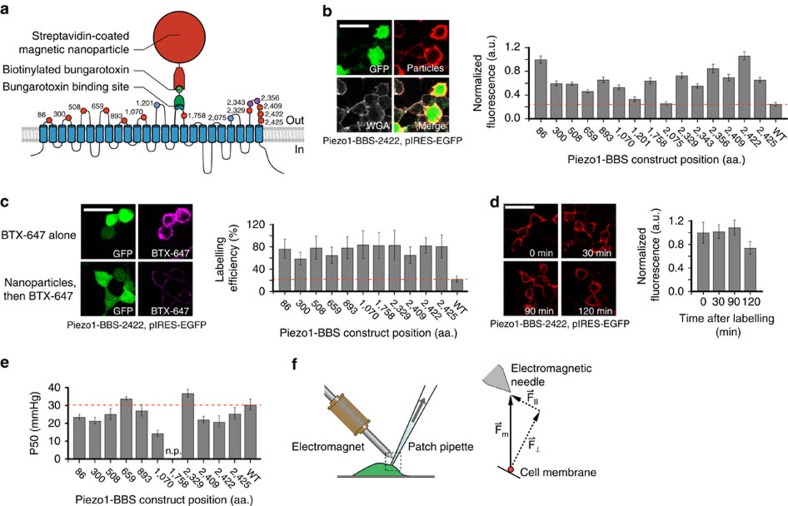
Figure 1. Localized force application by nanoparticle labelling and magnetic field generation.
(a) Piezo1 transmembrane topology with aa. locations of BBS insertions (red, labelled and functional; blue, non-labelled; magenta, non-functional) and schematic of bead labelling strategy. (b) Representative images of HEK293T cells expressing Piezo1-BBS-2422-pIRES-EGFP construct, live-labelled with streptavidin-coated nanoparticles, immunostained against streptavidin, and labelled with WGA to confirm membrane localization (green, GFP; red, anti-streptavidin; grey, WGA). Mean fluorescence intensity normalized to BBS-86 (a.u.) of nanoparticle labelling along the cell membrane for all constructs compared with wild-type Piezo1 (WT, red line) (n=10 cells per transfection, 2–5 transfections; P<0.0001 for all constructs except BBS-1201 and BBS-2075 (P>0.01), one-way ANOVA and NP multiple comparison). (c) Representative images of HEK293T cells expressing BBS-2422, live-labelled with either bungarotoxin (BTX)-Alexa Fluor 647 alone or first with nanoparticles, then followed by BTX-647 (green, GFP; magenta, BTX-647). Quantified labelling efficiency for all Piezo1-BBS constructs in comparison to WT (red line) (n=12 cells each, 1 transfection; P<0.0001, one-way ANOVA and NP multiple comparison). (d) Representative fluorescent images of HEK293T cells transfected with BBS-2422 as a function of time after surface labelling (red, anti-streptavidin) and mean membrane fluorescence intensity normalized against t=0 time point plotted versus time. (n=10 cells per transfection, 1–2 transfections; no significance between any time points, P>0.01, one-way ANOVA and Tukey's multiple comparison). (e) Average pressure of half-maximal activation (P50) for each construct (n=8–21 cells, 3–7 transfections) in comparison to wild-type Piezo1 (red line) (P<0.0001 for BBS-1070, one-way ANOVA and NP multiple comparison). Construct BBS-1758 did not reach a plateau current (n.p.), and a P50 value was not measured. (f) Diagram of patch-clamp pipette and electromagnetic needle and corresponding force diagram on nanoparticle (Fm, magnetic force vector; F⊥, force vector normal to patch membrane; F||, force vector parallel to patch membrane). Error bars are s.e.m. for all panels. Scale bar, 30 μm.

