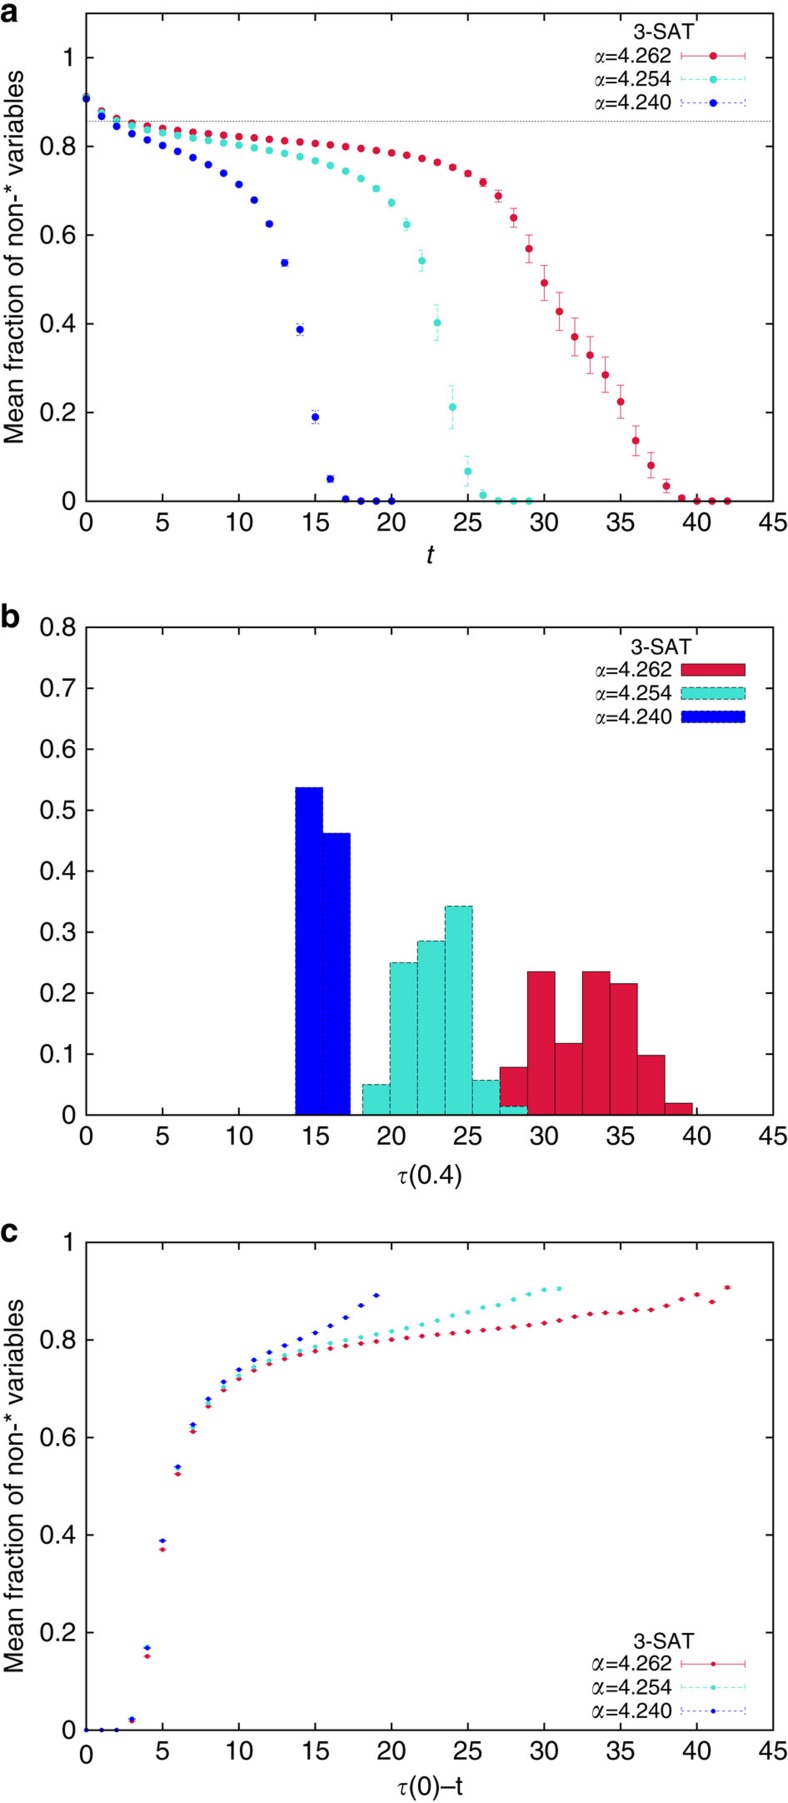
Figure 5. Whitening random 3-SAT solutions.
(a) The mean fraction of non- variables during the whitening procedure applied to all solutions found by the BSP algorithm goes to zero, following a two steps process. The relaxation time grows increasing α towards the algorithmic threshold. The horizontal line is the SP prediction for the fraction of frozen variables in typical solutions at α=4.262 and the comparison with the data shows that solutions found by BSP are atypical. (b) Histograms of the whitening times, defined as the number of iterations required to reach a fraction 0.4 of non- variables. Increasing α both the mean value and the variance of the whitening times grow. (c) Averaging the fraction of non- variables at fixed τ(0)−t, that is, fixing the time to the all- fixed point, we get much smaller errors than in (a), suggesting that the whitening procedure is practically solution-independent once the plateau is left. In all the panels, error bars are s.e.m.

