
FIGURE 5.
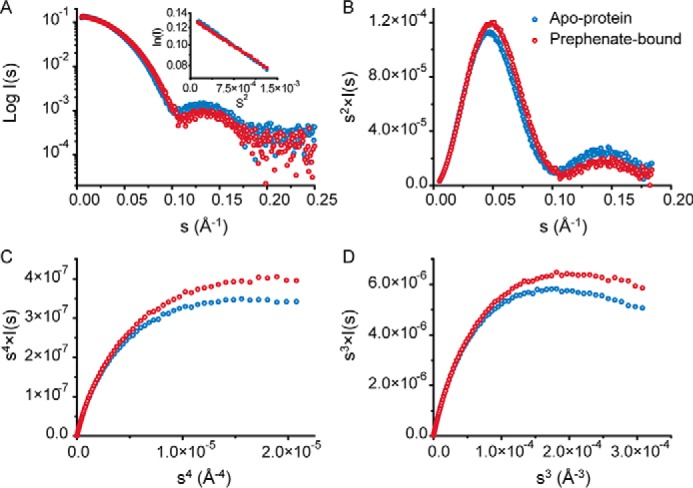
Analysis of the SAXS data for GspDAH7PS in the absence (blue) and presence (red) of prephenate. A, SAXS profiles (log I(q) versus q) with Guinier plots inset. B, Kratky plot (q2·I(q) versus q). C, Porod-Debye plot (q4·I(q) versus q4), and D, SIBYLS plot (q3·I(q) versus q3), limited to the range of the SAXS data for which the Guinier linearity is observed.