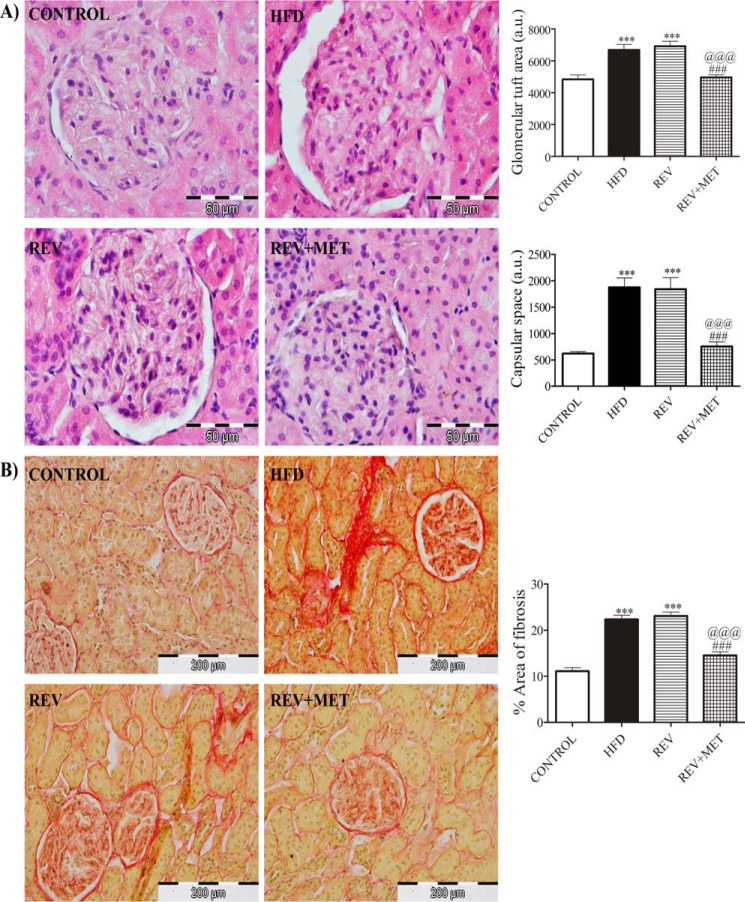
FIGURE 3.
H&E and picrosirius red staining of kidney. A, H&E-stained images under 1000× magnification along with quantification of glomerular tuft area and capsular space. B, picrosirius red-stained images showing glomerular fibrosis under 400× magnification along with quantification of interstitial fibrosis. CONTROL, rats fed with normal pellet diet; HFD, rats fed with high fat diet; REV, reversal group rats fed with normal pellet diet for 8 weeks following 16 weeks of high fat diet feeding; REV+MET, reversal group rats fed with normal pellet diet and treated with metformin (100 mg kg−1 day−1, p.o.) after 16 weeks of high fat diet feeding. n = 10–12 sections from each group. ***, p < 0.001 versus CONTROL; ###, p < 0.001 versus HFD; @@@, p < 0.001 versus REV.

