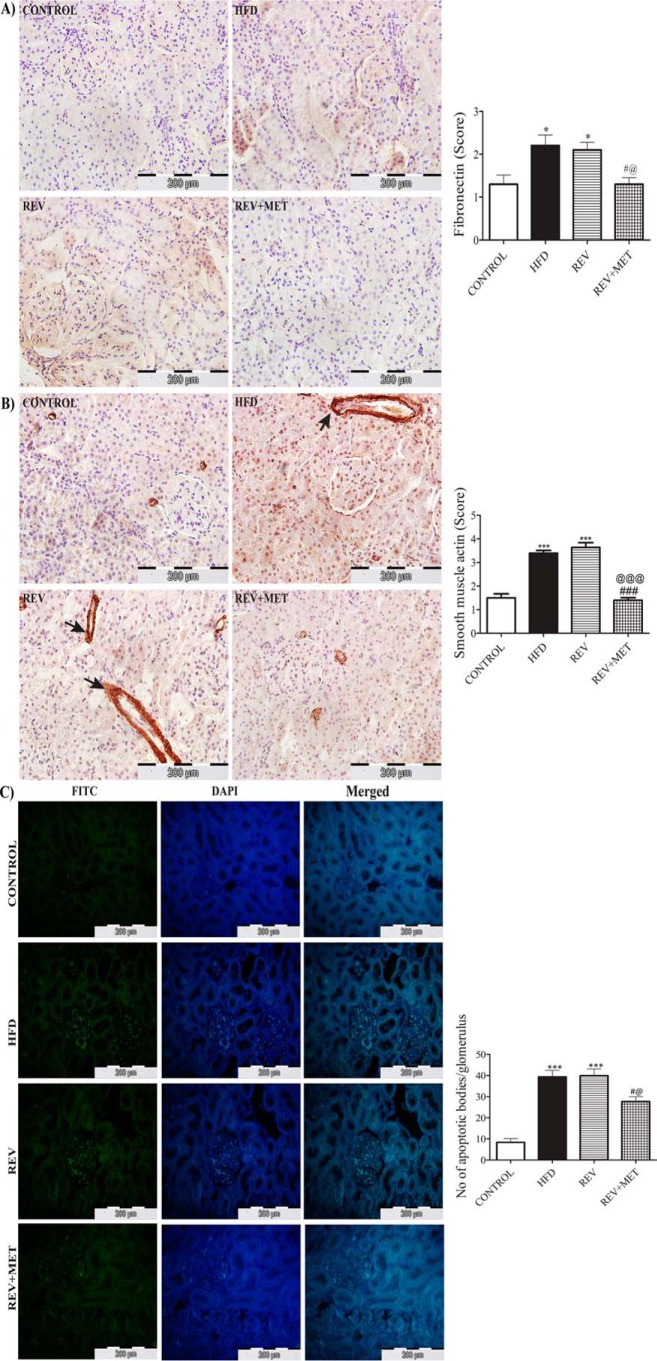
FIGURE 4.
Immunohistochemistry of renal fibronectin, α-SMA, and TUNEL assay in kidney sections. A and B, 3,3′-diaminobenzidine-stained images of fibronectin and α-SMA under 400× magnification (A) and quantification of immunohistochemistry by the indicated scoring method (B). Scores were measured as follows: 1 = no or very low color, 2 = mild color, 3 = moderate color, 4 = intense brown color. Arrows indicate the extracellular areas of α-SMA immunostaining. C, FITC and DAPI staining and merged images of TUNEL assay under 400× magnification along with quantification of apoptotic bodies/glomerulus. CONTROL, rats fed with normal pellet diet; HFD, rats fed with high fat diet; REV, reversal group rats fed with normal pellet diet for 8 weeks following 16 weeks of high fat diet feeding; REV+MET, reversal group rats fed with normal pellet diet and treated with metformin (100 mg kg−1 day−1, p.o.) after 16 weeks of high fat diet feeding. n = 10–12 sections from each group. *, p < 0.05 and ***, p < 0.001 versus CONTROL; #, p < 0.05, ###, p < 0.001 versus HFD; @, p < 0.05, @@@, p < 0.001 versus REV.

