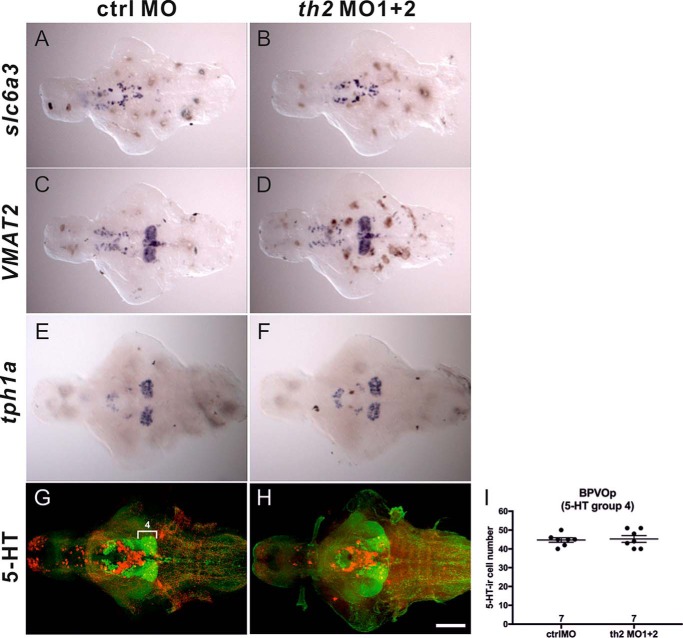
FIGURE 3.
The expression pattern of slc6a3, VMAT2, and tph1a and the distribution of 5-HT-ir cells in 5-dpf ctrlMO and th2MO1 + 2 morphant brains. A and B, slc6a3 ISH. C and D, VMAT2 ISH. E and F, tph1a ISH. G and H, double staining of TH1 and 5-HT. I, quantification of 5-HT-ir cells in the PVOp (5-HT group 4). TH1-labeled cells are shown in red and 5-HT-positive cells in green. Scale bar = 100 μm.

