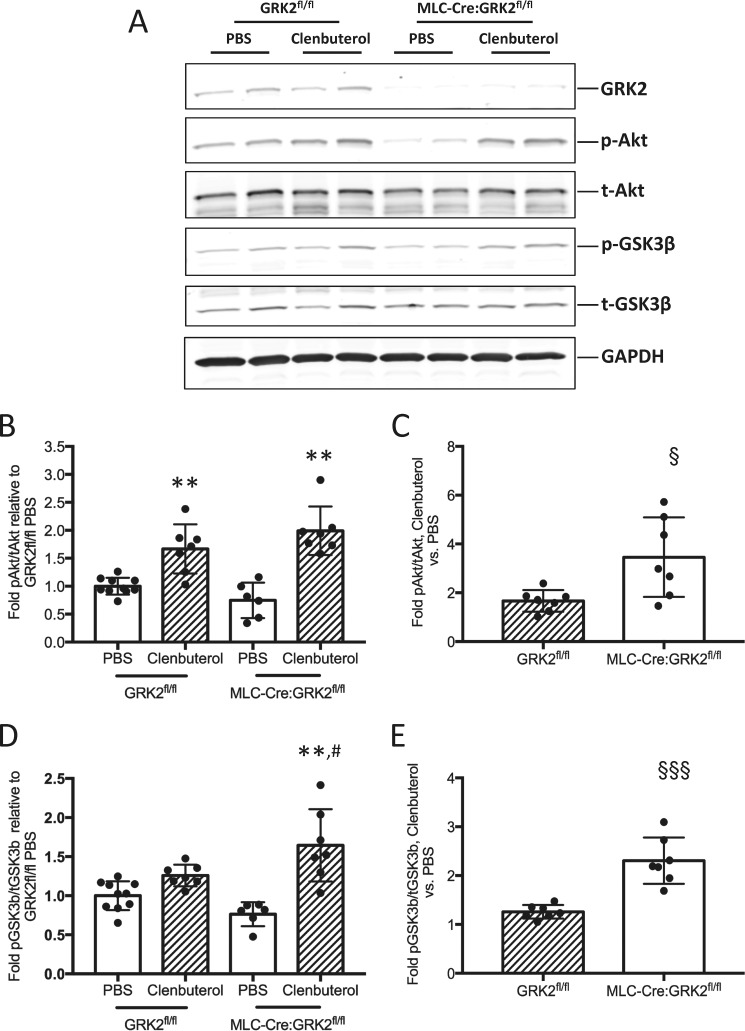
FIGURE 7.
Enhanced Akt signaling in clenbuterol treated MLC-Cre:GRK2fl/fl mice. A, Western blot analysis of p-Akt (Ser-473) and p-GSK3β (S9) levels in soleus muscle isolated from GRK2fl/fl and MLC-Cre:GRK2fl/fl mice 4 h after a single subcutaneous injection of PBS or clenbuterol (1 mg/kg). B, bars depict -fold change in signal intensity of p-Akt/t-Akt relative to the GRK2fl/fl PBS treated group; error bars represent S.D. **, p < 0.01 by ANOVA; PBS versus clenbuterol (same genotype). C, bars depict -fold increase in signal intensity of p-Akt/t-Akt in clenbuterol versus PBS-treated animals; error bars represent S.D. §, p < 0.05 by Student's t test. D, bars depict -fold change in signal intensity of p-GSK3β/t-GSK3β relative to the GRK2fl/fl PBS-treated group; error bars represent S.D. **, p < 0.01 by ANOVA; PBS versus Clenbuterol (same genotype); #, p < 0.05 by ANOVA; GRK2fl/fl clenbuterol versus MLC-Cre:GRK2fl/fl clenbuterol. E, bars depict -fold increase in signal intensity of p-GSK3β/t-GSK3β in clenbuterol versus PBS-treated animals; error bars represent S.D. §§§p < 0.001 by Student's t test. n = 6–10 mice per group.

