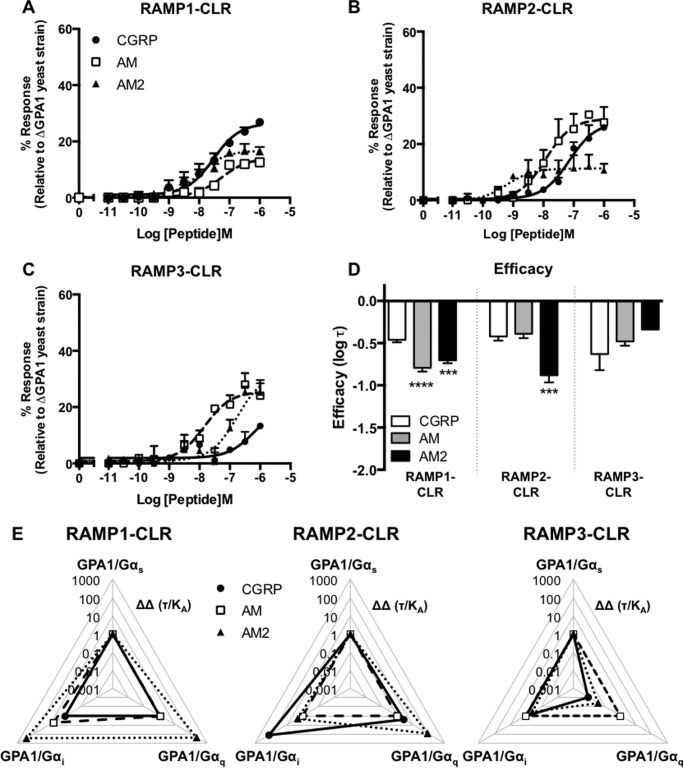
FIGURE 7.
Functional coupling of CLR co-transformed with all three RAMPs to the Gαq chimera. Dose-response curves to CGRP, AM, and AM2 were constructed in yeast strains containing the GPA1/Gαq chimera and expressing CLR with RAMP1 (n = 7) (A), RAMP2 (n = 6) (B), and RAMP3 (n = 7) (C). Reporter gene activity was determined following 24-h stimulation. All data are expressed as percentage of the maximum response observed in yeast strain MMY11 and are means ± S.E. of n individual data sets. D, Bar chart showing the efficacy of each ligand for each RAMP-CLR combination at the Gαq chimera determined via application of the operational model of receptor agonism (Ref. 34 and Table 1). Data were determined as statistically different from the cognate ligand for each receptor (***, p < 0.001; ****, p < 0.0001) using one-way ANOVA with Bonferroni's post-test. E, signaling bias plots were calculated as ΔΔ(τ/Ka) values on a logarithmic scale for each ligand and for each chimera G protein for the three individual RAMP-CLR complexes. Determination of values requires normalization to a reference ligand (CGRP for RAMP1-CLR and AM for CLR with RAMP2 or RAMP3) and a reference pathway (in all cases, GPA1/Gαs).

