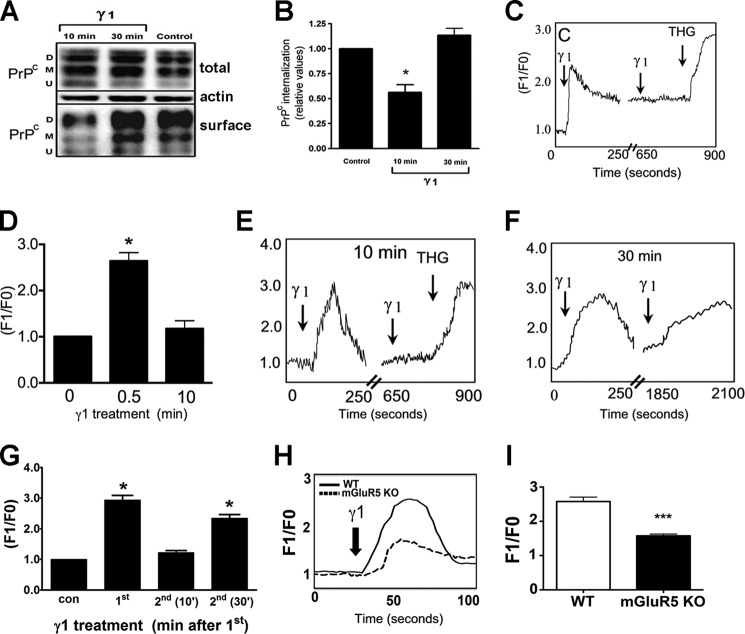
FIGURE 2.
Effect of Ln-γ1 treatment on PrPC localization and intracellular calcium in cells. A and B, Ln-γ1 induces transient PrPC internalization in CF10 cells. A, representative Western blotting image of diglycosylated (D), monoglycosylated (M) and unglycosylated (U) forms of PrPC. B, quantification of surface/total protein levels from at least 3 independent experiments. C and D, Ln-γ1 induces an increase in intracellular Ca2+ levels in CF10 cells, and repeated administration of Ln-γ1 over 10 min has no effect. C, calcium response (relative Fluo-4 fluorescence kinetics) induced by Ln-γ1. Thapsigargin (1 μm) (THG) was used as a positive control for intracellular calcium mobilization. D, quantification of Ca2+ levels, averaged from at least 60 cells measured in at least 3 independent experiments. E–G, Ln-γ1 induces increase in intracellular Ca2+ levels in primary hippocampal neurons. E, relative Fluo-4 fluorescence kinetics of the initial Ln-γ1 treatment and the repeated one in 10 min. F, the same for the repeated γ1 treatment in 30 min after the initial one. G, quantification of Ca2+ levels, averaged from at least 60 cells measured in at least 3 independent experiments. H and I, Ln-γ1-induced increase in intracellular Ca2+ in wild-type and mGluR5−/− neurons. H, relative Fluo-4 fluorescence kinetics. I, quantification of Ca2+ signal amplitude, averaged from at least 60 cells measured in at least 3 independent experiments. Error bars indicate mean ± S.E. *, p < 0.05; ***, p < 0.001.

