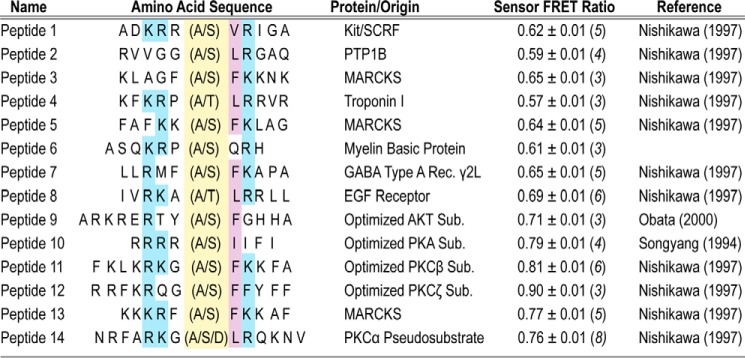
FIGURE 2.
PKCα FRET sensors display a range of basal FRET interactions. Peptides used in activity assays (Ser- or Thr-containing) or FRET-based sensors (Ala- or Asp-containing) are shown. In the amino acid sequence, the phosphorylation site is highlighted in yellow. Blue (hydrophobic) or purple (basic) shading indicates consensus site residues important for phosphorylation (18). The basal FRET ratio is shown for each alanine-containing sensor and are derived from at least three protein preparations (n ≥ 3 preparations).

