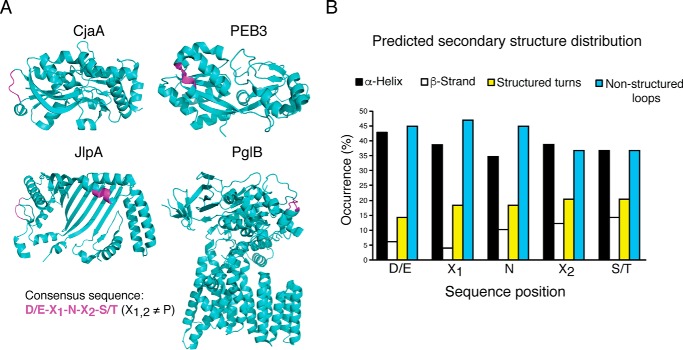
FIGURE 2.
In silico analysis of diverse secondary structures of N-glycosylation sequons. A, schematic representation of x-ray crystallographic structures of CjaA, PEB3, JlpA, and PglB (PDB codes 1XT8, 2HXW, 3UAU and 3RCE, respectively). The glycosylation consensus sequence ((D/E)X1NX2(S/T), X1,2≠P) is colored in magenta. B, in silico analysis of 53 glycosylation consensus sequence secondary structures. Each residue was classified as α-helix, β-strand, structured turn, or non-structured loop and is represented as an average distribution for each site. Structures were predicted using Phyre2.

