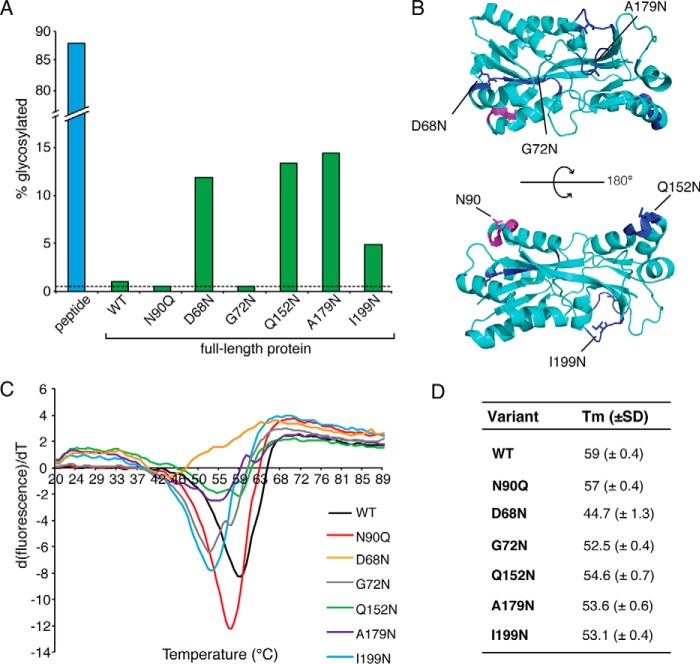
FIGURE 3.
In vitro analysis of PEB3, PEB3 variants, and peptide substrate. A, the percentage of radiolabeled disaccharide transferred to protein (green bars) or peptide substrate (blue bar) was measured by liquid scintillation counting. Results are representative of one data set from triplicate experiments. Background activity is indicated by dashed line. B, schematic representation of PEB3 and the position where the glycosylation consensus sequence is substituted for each variant. The native consensus sequence is colored in magenta, repositioned consensus sequences are colored in blue, and the positions of the glycosylated asparagine residues are represented as sticks. First derivative curves of averaged thermal denaturation data collected from three replicates (C), and calculated Tm values of each PEB3 variant with standard deviation were determined from triplicate experimental results (D).

