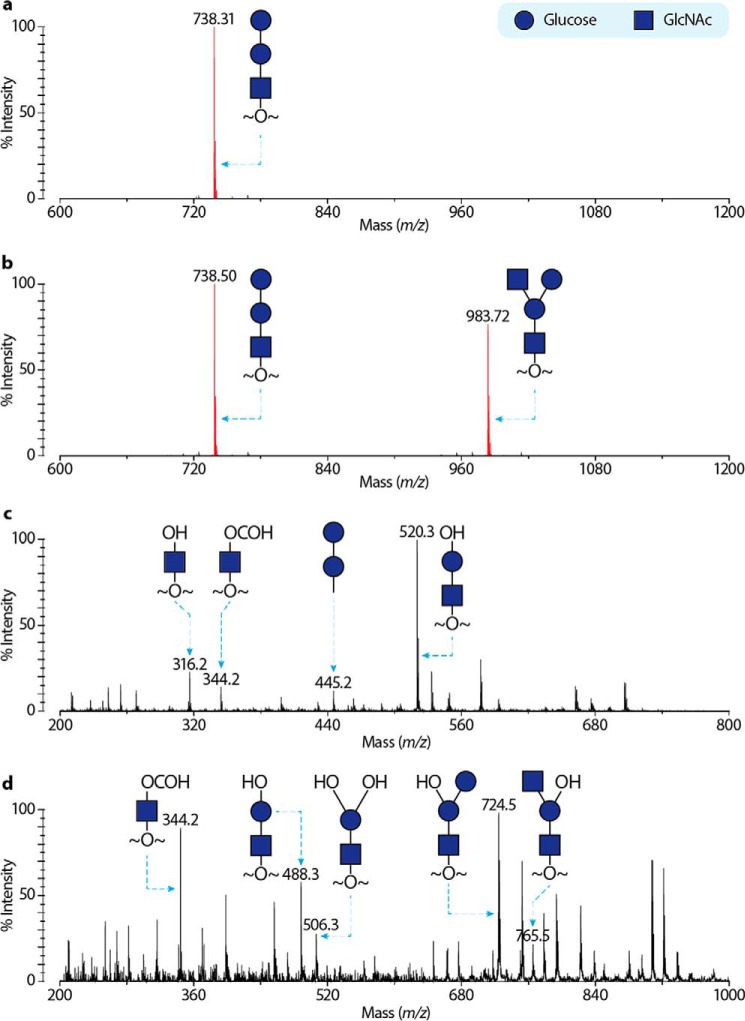
FIGURE 2.
Mass spectra of DUF1792 and dGT1 modified rFap1. Glycans from recombinant Fap1 proteins were reductively released and permethylated. Derivatized glycans were purified and analyzed by MS. Representative spectra were shown in a (DUF1792 modified rFap1) and b (dGT1 modified rFap1). Peaks corresponding to sodiated glycans are colored red and annotated with m/z and glycan structures. Black signals are due to under-permethylation (minus 14 in m/z) or the matrix contaminations. c, MS/MS of the MS peak at m/z 738 from a; d, MS/MS of the MS peak at m/z 983 from b.

