FIGURE 4.
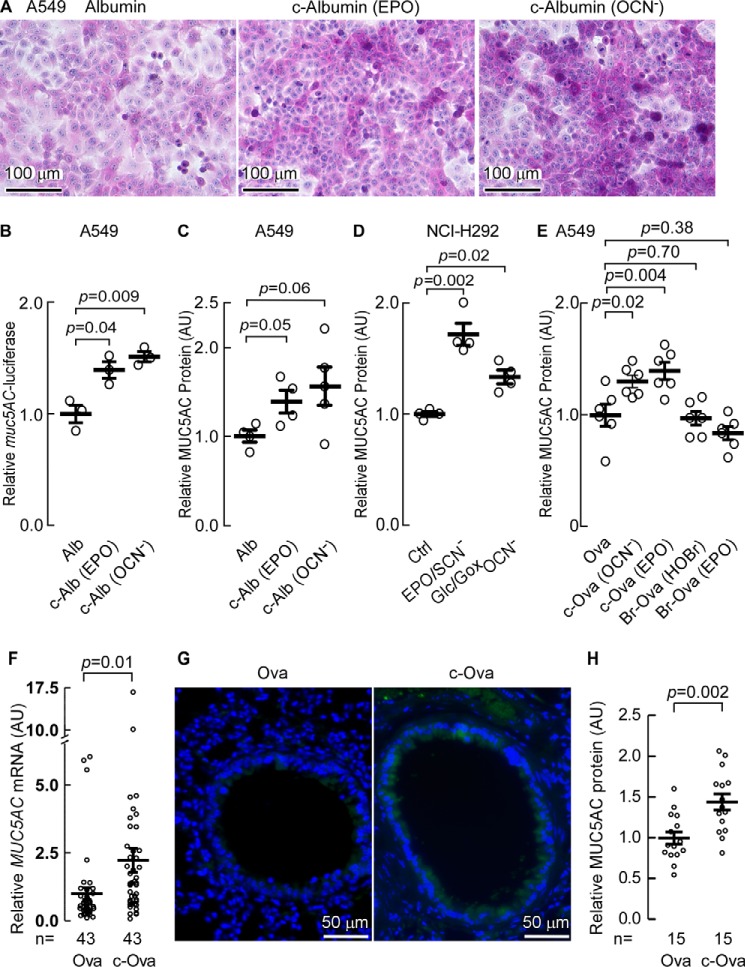
Carbamyl protein exposure increases mucin expression. A, PAS-hematoxylin staining of A549 cells 24 h after exposure to albumin or carbamyl-albumin (c-albumin). B, expression from the muc5AC promoter in A549 cells monitored by Dual-Glow luciferase activity assay after transfection with pmuc5AC-Luc3-basic and pTK-RL. Cells were starved for 1 day and then incubated in serum-free medium with either albumin, EPO/SCN−/H2O2 catalyzed c-Alb (EPO) or OCN− carbamylated albumin (c-Alb (OCN−)), as described under “Experimental Procedures,” and muc5AC promoter-driven luciferase expression was determined. C, MUC5AC accumulation in A549 cells incubated with carbamylated protein as in B was determined by MUC5AC-specific ELISA. D, secretion of MUC5AC into the cell growth media from NCI-H292 monitored by MUC5AC-specific ELISA after incubation with the indicated albumin, EPO-carbamylated albumin or OCN−-carbamylated albumin proteins as in B. The results were expressed as the relative concentration of MUC5AC normalized to control cells having a value of 1 arbitrary unit (AU). E, MUC5AC accumulation in A549 cells incubated for 1 day with 20 μg/ml of carbamylated ovalbumin either by reaction with OCN− or the EPO/SCN−/H2O2 complete system, or brominated ovalbumin either by reaction with HOBr or EPO/Br−/H2O2, with modified ovalbumin labeled as c-Ova (OCN−), c-Ova (EPO), Br-Ova (HOBr), and Br-Ova (EPO), respectively. The concentration of MUC5AC was determined by ELISA and the results are expressed as the relative concentration to the cells incubated with ovalbumin. F, RT-PCR determination of MUC5AC expression in mice after OVA or c-OVA challenge. Cumulative n values for animal numbers from several replicate studies are listed where RT-PCR were analyzed for MUC5AC gene expression. G, immunohistochemical staining of mouse lung tissues with anti-MUC 5AC antibody from C57BL/6J WT mice challenged with c-OVA versus OVA. H, ELISA quantitation of MUC5AC expression in lung tissues. Scatter plots indicate individual replicates and the mean ± S.E. is indicated (B–F and H). Cumulative n values for animal numbers are reported (F and H).

