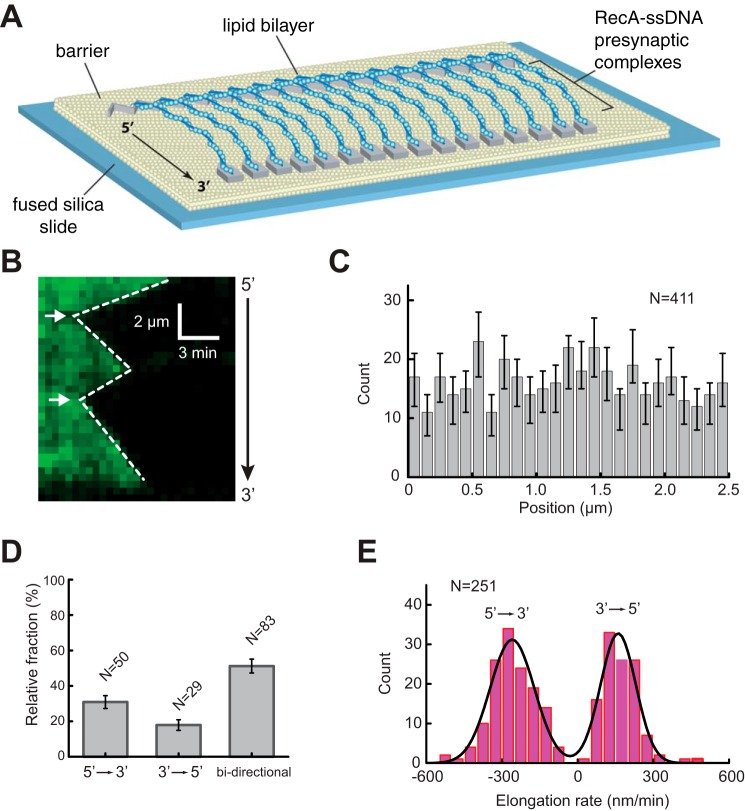
FIGURE 1.
RecA presynaptic complex assembly. A, schematic of double-tethered ssDNA curtain assay with RecA presynaptic complexes. B, representative kymograph showing the displacement of RPA-eGFP by unlabeled RecA. White arrowheads highlight the RecA filament nucleation sites for this particular ssDNA molecule. C, histogram showing the relative positions of observed nucleation events along one unit length of the M13 ssDNA substrate. The error bars represent 70% confidence intervals obtained through bootstrap analysis. D, fractions of filaments that exhibited 5′ → 3′, 3′ → 5′, and bi-directional elongation. The error bars represent standard deviation. E, observed RecA filament elongation rates for 5′ → 3′ and 3′ → 5′ assembly, as indicated. The black line corresponds to a double Gaussian fit to the data.

