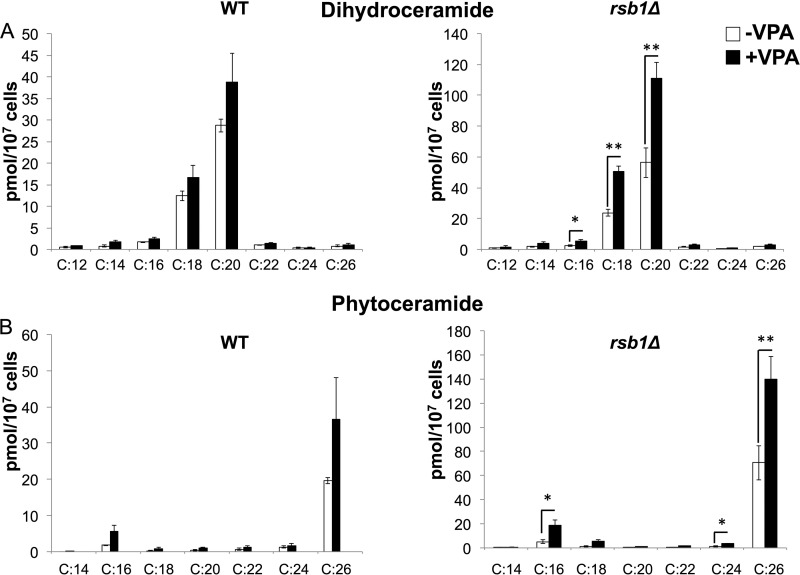
FIGURE 3.
VPA increases levels of DHC and PHC. WT and rsb1Δ cells were grown as described in the legend to Fig. 1. Cells were pelleted, and DHC (A) and PHC (B) levels with varying fatty acids were quantified by mass spectrometry. Data shown are mean ± S.D. (error bars) (n = 6; *, p < 0.05; **, p < 0.01).

