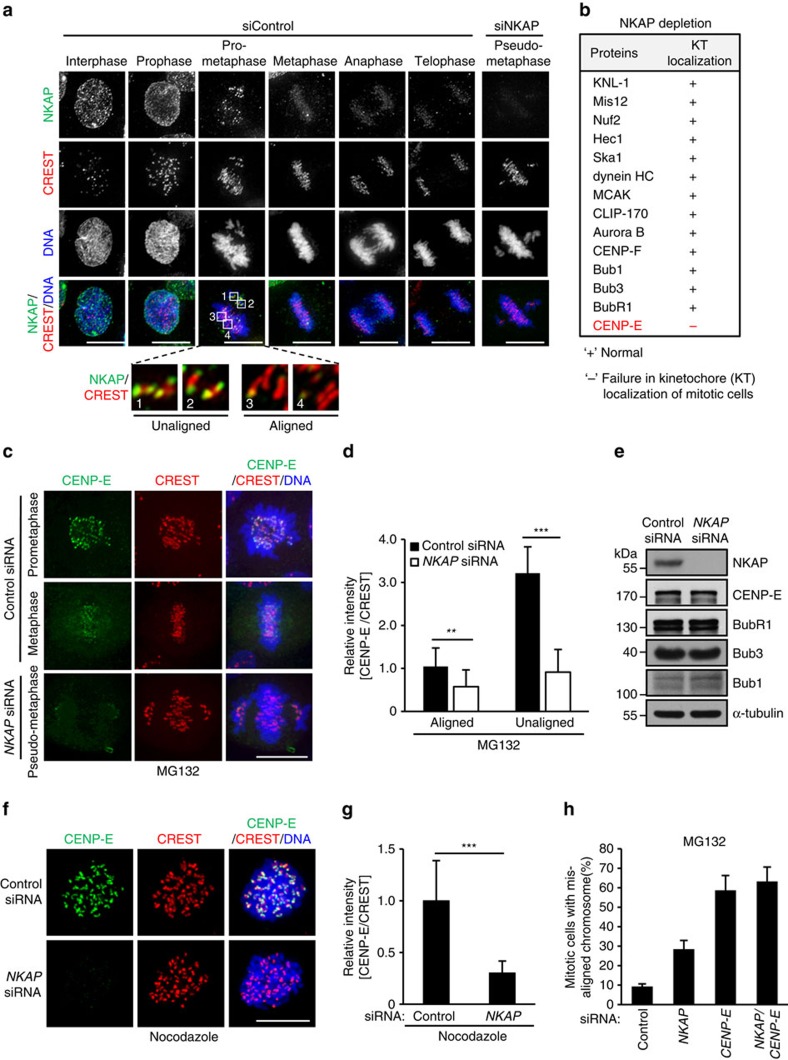
Figure 2. NKAP depletion impairs CENP-E kinetochore localization.
(a) Immunofluorescence staining of NKAP in HeLa cells transfected with control or NKAP siRNA. The boxed regions are magnified to show typical NKAP localization on kinetochores during prometaphase. (b) Table summarizing the effect of NKAP depletion on kinetochore/centromere localization of the indicated proteins. HeLa cells were transfected with siRNAs for 48 h before MG132 treatment for 2 h. ‘+' and ‘−' represent normal or failure in kinetochores localization of the proteins in NKAP-knockdown cells, respectively. (c) Decreased CENP-E localization on kinetochores in NKAP-depleted cells. HeLa cells were treated as described in b and then stained for CENP-E (green), CREST (red) and DNA (blue). (d) Quantification of relative fluorescence intensity of the CENP-E signal at kinetochores on aligned or misaligned chromosomes. Unaligned chromosomes of the control cells were selected from prometaphase cells. Fluorescence intensity of CENP-E on aligned kinetochores in control cells were normalized to 1. Data are shown as mean±s.d. n≥200 kinetochores from 20 cells for each group of each experiment. **P<0.01, ***P<0.001 (two-sided student's t-test). (e) HeLa cells were treated as described in b, and analysed by immunoblots with the indicated antibodies. (f) Decreased CENP-E localization on kinetochores in NKAP-depleted cells at prometaphase. HeLa cells were treated with control or NKAP siRNA for 48 h followed by arresting with nocodazole. Cells were stained for CENP-E (green), CREST (red) and DNA (blue). (g) Quantification of relative fluorescence intensity of the CENP-E signal on kinetochores in cells as described in f. Fluorescence intensity of CENP-E in control cells was normalized to 1 (n≥5 cells, >200 kinetochores of each experiment). Data are shown as mean±s.d. and are representative of three independent experiments. ***P<0.001 (two-sided Mann–Whitney U test). (h) Quantitative analysis of mitotic cells with misaligned chromosomes. HeLa cells were transfected with the indicated siRNAs for 48 h, and then treated with MG132 for 2 h. Cells were randomly selected for observation and statistics. Data are representative of three independent experiments and shown as mean±s.d. All scale bars indicate 10 μm.

