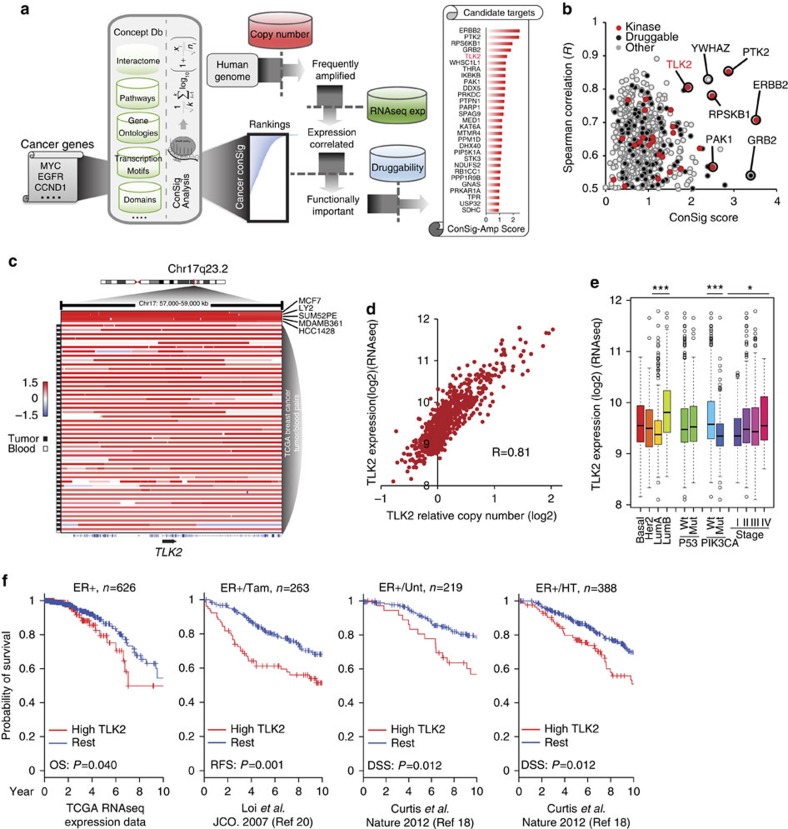
Figure 1. ConSig-Amp identifies TLK2 as a candidate druggable target frequently amplified in breast cancer.
(a) The bioinformatics workflow of ConSig-Amp to discover therapeutically relevant oncogene targets in cancer at genome-wide scale based on copy-number and RNAseq data sets. The ConSig-Amp score is calculated by multiplying the ConSig score (see Methods) with the correlation between gene expression and copy number. (b) Prioritizing amplified breast cancer oncogene targets by ConSig score and Spearman's correlation between copy number (Affymetrix SNP 6.0 array) and gene expression (RNAseq). Data shown here are from TCGA. (c) Representative copy-number data showing amplifications at the TLK2 locus in paired breast tumour and peripheral blood (data from TCGA52), or breast cancer cell lines (data from Heiser et al.21). This figure is based on Affymetrix SNP 6.0 array data annotated with genome build hg18. Positive cell line or tumour samples are sorted based on the level of TLK2 amplifications, and the structures of genes involved in the presented region are shown under the illustration. (d) TLK2 expression (based on RNAseq data) is primarily regulated by gene copy number (based on Affymetrix SNP 6.0 array data). The Spearman's correlation is R=0.81. (e) TLK2 expression in different breast cancer subtypes based on RNAseq data. Copy number and RNAseq expression data shown in d,e are from TCGA. The whiskers indicate the max and min values (excluding outliers) and horizontal lines represent the 1st, 2nd and 3rd quartiles. *P<0.05; ***P<0.001. (f) Kaplan–Meier plots based on multiple gene expression data sets showing correlation of TLK2 overexpression with the outcome of systemically untreated or endocrine-treated ER+ breast cancer patients. HT, hormone treated; Tam, tamoxifen-treated; Unt, untreated. P values are calculated based on log-rank tests.

