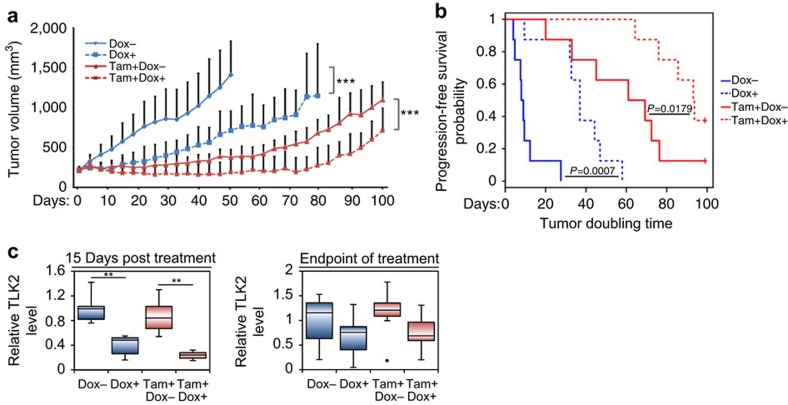
Figure 5. The therapeutic effect of TLK2 inhibition in a MCF7 preclinical xenograft tumour model.
(a) The effect of TLK2 inhibition in the MCF7 xenograft tumours inducibly expressing a TLK2 shRNA, in the presence or absence of concomitant tamoxifen treatment. The average tumour growth in each treatment group (8 mice per group). Error bars represent the s.d. of tumour volumes of 8 mice measurements per condition. P values were calculated based on ANOVA to compare the tumour volumes. (b) Kaplan–Meier survival plot comparing the progression-free survival of different treatment groups (based on tumour-doubling time). Generalized Wilcoxon test was used to calculate the P values for comparing progression-free survival between different treatment groups. (c) Quantitative western blot analysis of TLK2 protein expression in the tumours harvested after 15 days of treatment (5 mice/group), or at the end point (8 mice per group). Error bars represent the s.d. of relative TLK2 levels of 5 or 8 mice measurements per condition. *P<0.05; **P<0.01; ***P<0.001. Dox, doxycycline. Corresponding western blot images are shown in Supplementary Fig. 8.

