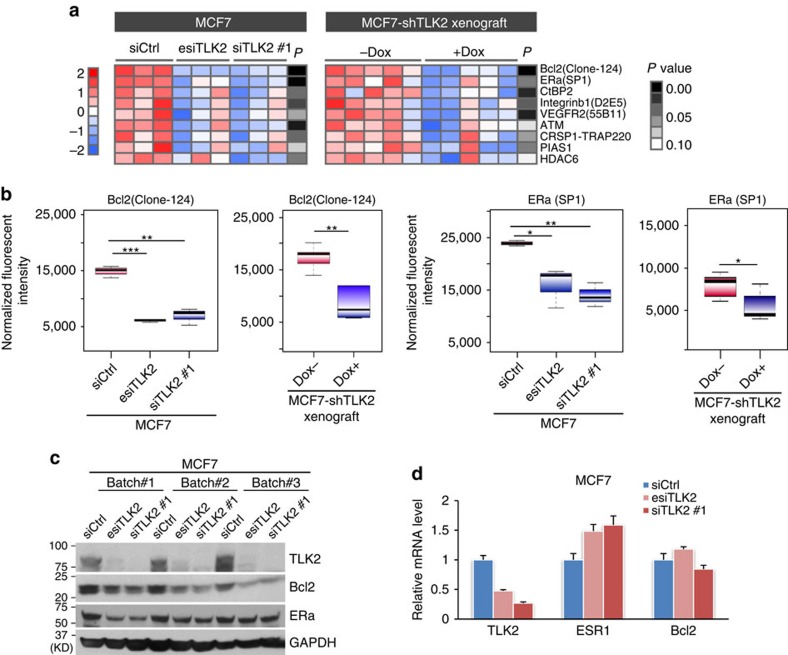
Figure 6. RPPA profiling results after TLK2 knockdown in MCF7 cells or MCF7 xenograft tumours inducibly expressing shTLK2.
(a) The heat-map of consistently altered signalling proteins revealed by RPPA analyses of MCF7 cells ±TLK2 KD and MCF7 xenograft tumours harvested 2 weeks after induction of TLK2 inhibition. Proteins that showed a consistent trend of changes (P<0.1) in both in vitro and in vivo models are shown in the heat-map, and are sorted by the mean P values of different comparisons. For RPPA profiling, each knockdown experiment was repeated three times biologically. P values were calculated based on t-test and are shown in grey scale. (b) Boxplots of normalized fluorescent intensities of Bcl2 or ERα after TLK2 knockdown in MCF7 cells (3 repeats for each group) or MCF7 xenograft tumours (5 tumours in each group). The whiskers indicate the max and min values and horizontal lines represent the 1st, 2nd and 3rd quartiles. (c) Western blot validation of Bcl2 and ERα protein changes after TLK2 knockdown in MCF7 cells. (d) Q-PCR results quantifying relative mRNA level of TLK2, ERα, or Bcl2 after TLK2 silencing by transfecting MCF7 cells with 10 nM of siCtrl, esiTLK2, or siTLK2 #1. Error bars represent the s.d. of three replicate measurements per condition.

