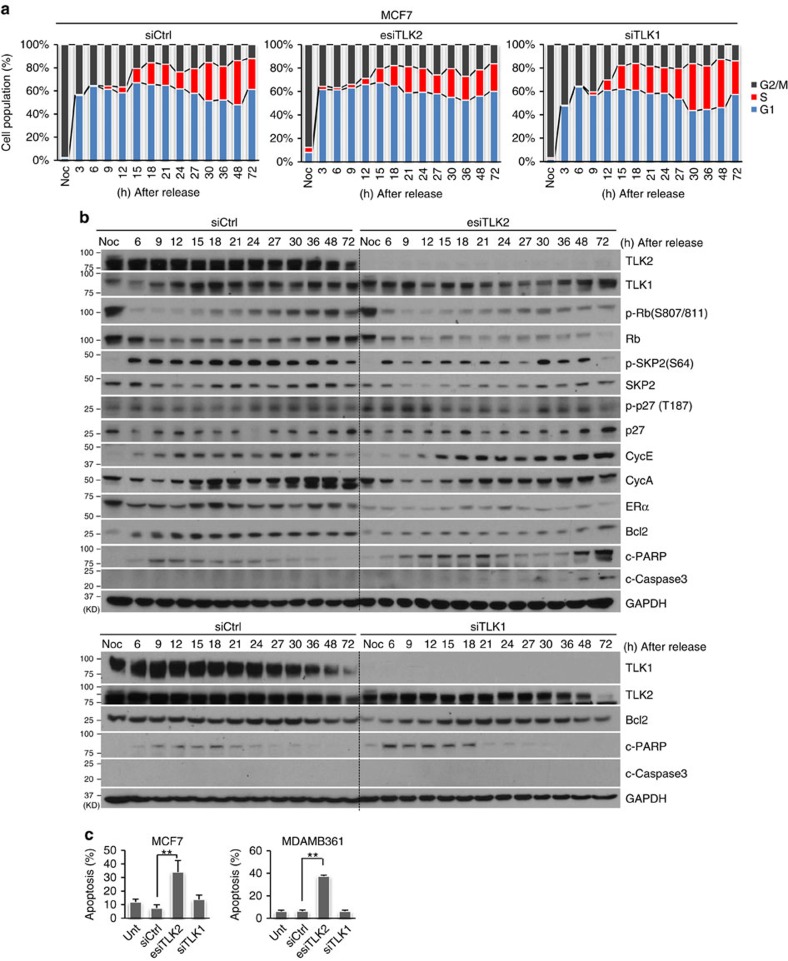
Figure 8. TLK2-amplified luminal breast cancer cells respond differentially to TLK2 or TLK1 inhibition.
(a) Cell cycle profile of MCF7 cells synchronized by nocodazole block after TLK2 or TLK1 knockdown. After TLK2 or TLK1 silencing by transfecting 10 nM of esiTLK2 or siTLK1 for 24 h, MCF7 cells were synchronized at mitosis using 200 nM nocodazole for 15 h, and then released. Cells were collected at the indicated time after cell cycle release. To precisely determine S-phase cell population, 10 μM of BrdU was added for 1.5 h before cell collection. The cell cycle distributions were determined based on DNA content and BrdU incorporation (Supplementary Fig. 12). (b) Western blot was done to examine the changes of key signalling molecules involved in G1/S cell cycle regulation and apoptosis using the cell lysates obtained from same experiment as in Fig. 8a. ‘Noc' indicates the MCF7 cells synchronized at mitosis by nocodazole block (before cell cycle release). (c) Cell apoptosis assessed by Annexin V assay in asynchronized MCF7 and MDAMB361 cells following 20 nM of esiTLK2, siTLK1, or siCtrl treatment for 72 h. Error bars represent the s.d. of two replicate measurements per condition. P values are calculated based on t-test. **P<0.01.

