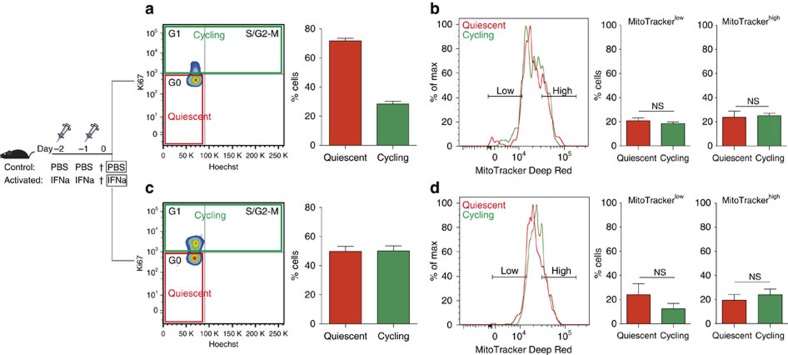
Figure 3. Quiescent and cycling HSC populations in the native niche have comparable mitochondrial activity levels.
(a) Cell cycle analysis using Ki67 and Hoechst staining on freshly isolated HSCs (LKS CD150+ CD48− CD34−) indicate that more than 70% of the cells are in a quiescent state (G0, red), with the remaining cells cycling (G1+S/G2-M, green) (n=3). (b) Flow cytometry analysis of quiescent and cycling HSCs based on mitochondrial activity labelled with MitoTracker Deep Red. Both, quiescent and cycling HSCs show overlapping mitochondrial activity profiles. The proportion of low and high mitochondrial activity cells within the quiescent and cycling HSC populations is similar (MitoTrackerlow: P=0.44, MitoTrackerhigh: P=0.81; n=3; error bar: s.e.m., t-student). (c) IFN-α stimulation results in in vivo activation of HSCs as demonstrated by Hoechst/Ki67 staining (n=3). (d) Flow cytometry analysis shows overlapping MitoTracker profiles of quiescent and cycling HSCs in IFN-α condition. Similarly, the proportion of MitoTrackerlow and MitoTrackerhigh cells in quiescent and cycling HSCs remains comparable (MitoTrackerlow: P=0.32, MitoTrackerhigh: P=0.54; n=3; error bar: s.e.m., t-student), suggesting that mitochondrial activity is independent of HSC cell cycle state even under acute stress conditions.

