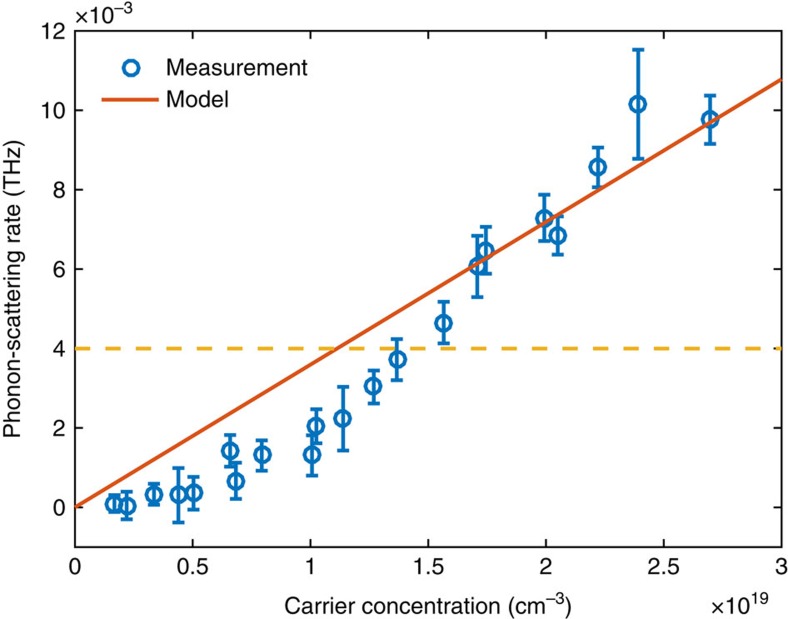
Figure 4. Comparison between experiment and theory.
The measured 250 GHz phonon-scattering rate due to electron–phonon interaction, compared with the theoretical prediction in ref. 34. The yellow dashed line labels the phonon attenuation level without the 780 nm excitation beam, as a reference. The reported data were measured on five different locations of the membrane, and each data point represented average of 10–30 measurements. The error bars are the s.d.'s of the measurement results that are averaged.

