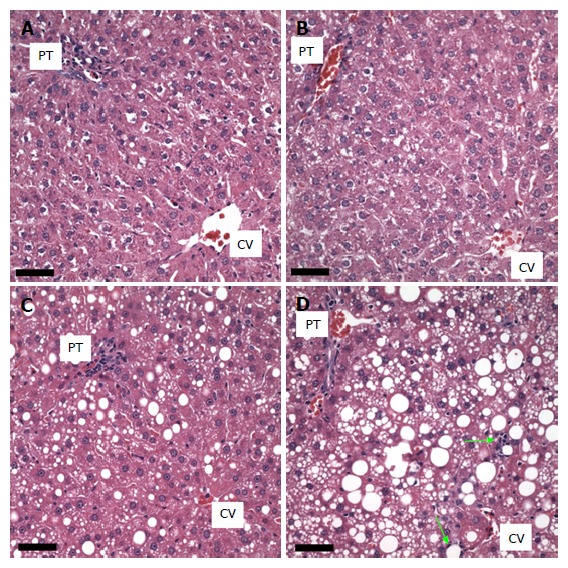
Figure 2.

Effect of dietary ethanol or/and guanidinoacetate ingestion on liver histology. Hematoxylin-eosin stained images of livers from animals fed the following diets are shown: Pair-fed control (A); 0.36% guanidinoacetate (GAA) (B); ethanol (C); ethanol + 0.36% GAA (D). Scale bars = 50 microns. Limited macrosteatosis was observed following the ethanol diet while much more extensive macrosteatosis with a limited number of cells exhibiting microsteatosis and a couple of small lipogranulomas (arrows) are seen in the livers of animals on the ethanol + 0.36% GAA diet. The livers of the animals on the 0.36% GAA diet are similar to the control livers. PT: Portal triad; CV: Central vein.
