Figure 3.

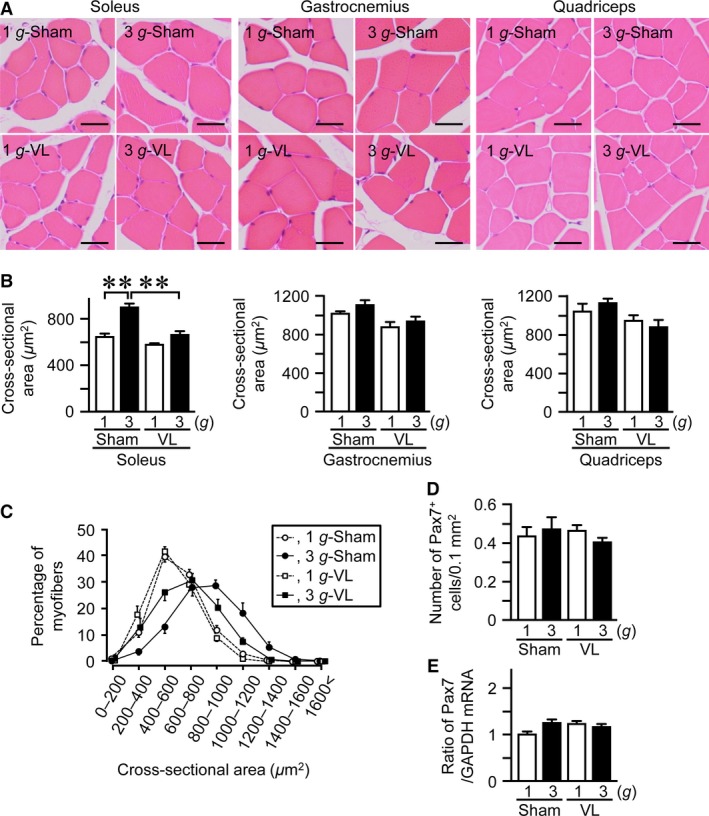
Effects of vestibular lesion (VL) on hypergravity‐induced changes in myofiber in the muscles. Hematoxylin and eosin‐stained sections (A) and cross‐sectional area (B) of myofiber in the soleus, gastrocnemius, and quadriceps muscles of mice with VL or sham operation after exposure to 1 g or 3 g for 4 weeks. Scale bars indicate 25 μm (A). (C) Distribution of myofiber size of the soleus muscle in mice with VL or sham operation after exposure to 1 g or 3 g for 4 weeks. Number of Pax7‐positive (Pax7+) cells assessed by immunohistochemistry (D) and the levels of Pax7 mRNA assessed by real‐time PCR (E) in the soleus muscles of mice with VL or sham operation after exposure to 1 g or 3 g for 4 weeks. Data represent the mean ± SEM of 8 (1 g sham and 3 g sham groups), 9 (1 g VL group), and 7 (3 g VL group) mice (B–D). Data represent the mean ± SEM of eight mice in each group (E). **P < 0.01.
