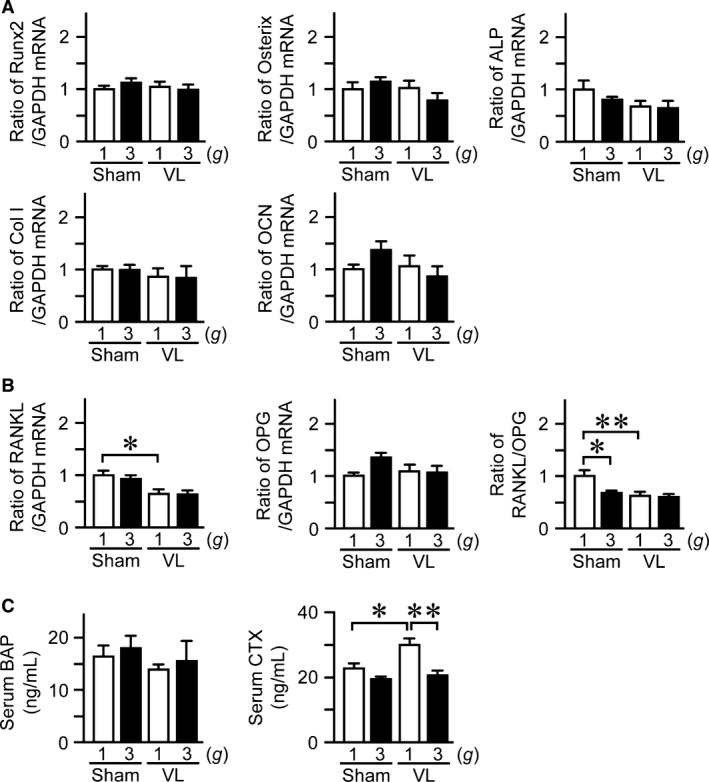
Figure 5.

Effects of hypergravity and VL on bone metabolism. Real‐time PCR analysis of Runx2, Osterix, ALP, type I collagen (Col I), OCN (A), RANKL, OPG, and the ratio of RANKL/OPG (B) in the tibias of mice with VL or sham operation after exposure to 1 g or 3 g for 4 weeks. (C) Serum levels of BAP and CTX in mice with VL or sham operation after exposure to 1 g or 3 g for 4 weeks. Data represent the mean ± SEM of eight mice in each group (A–C). *P < 0.05. **P < 0.01.
