
Figure 3.
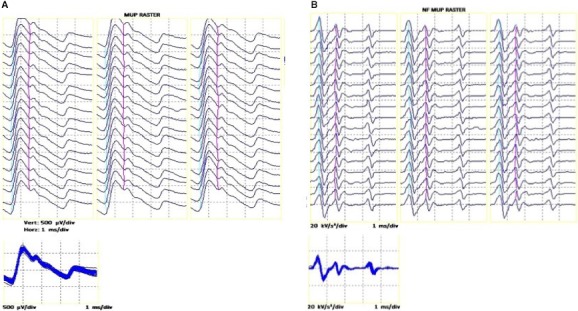
Repeated firing of a single intramuscular motor unit potential (A) and its corresponding near fiber (NF) motor unit potential (B), shown consecutively as a raster plot and also overlaid in the subplots. All data are taken from a master athlete.