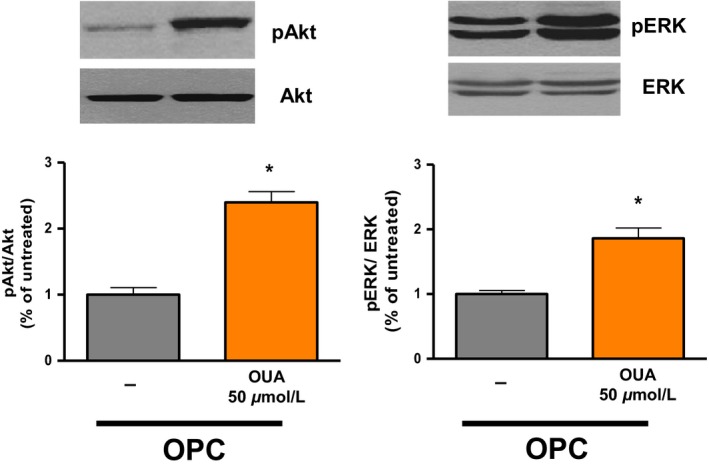
Figure 7.

Effect of ouabain 50 μmol/L on Akt phosphorylation and ERK phosphorylation in hearts preconditioned with ouabain. Total and phosphorylated forms of Akt (left) and ERK (right). Upper panels: representative immunoblots. Lower panels: activation quantified as ratio of phosphorylated to total form of the indicated protein. These ratios are normalized to one OPC sample/gel, which was assigned the value of 1. Shown are means ± SEM from 3three to eight independent experiments. *P < 0.05 versus OPC.
