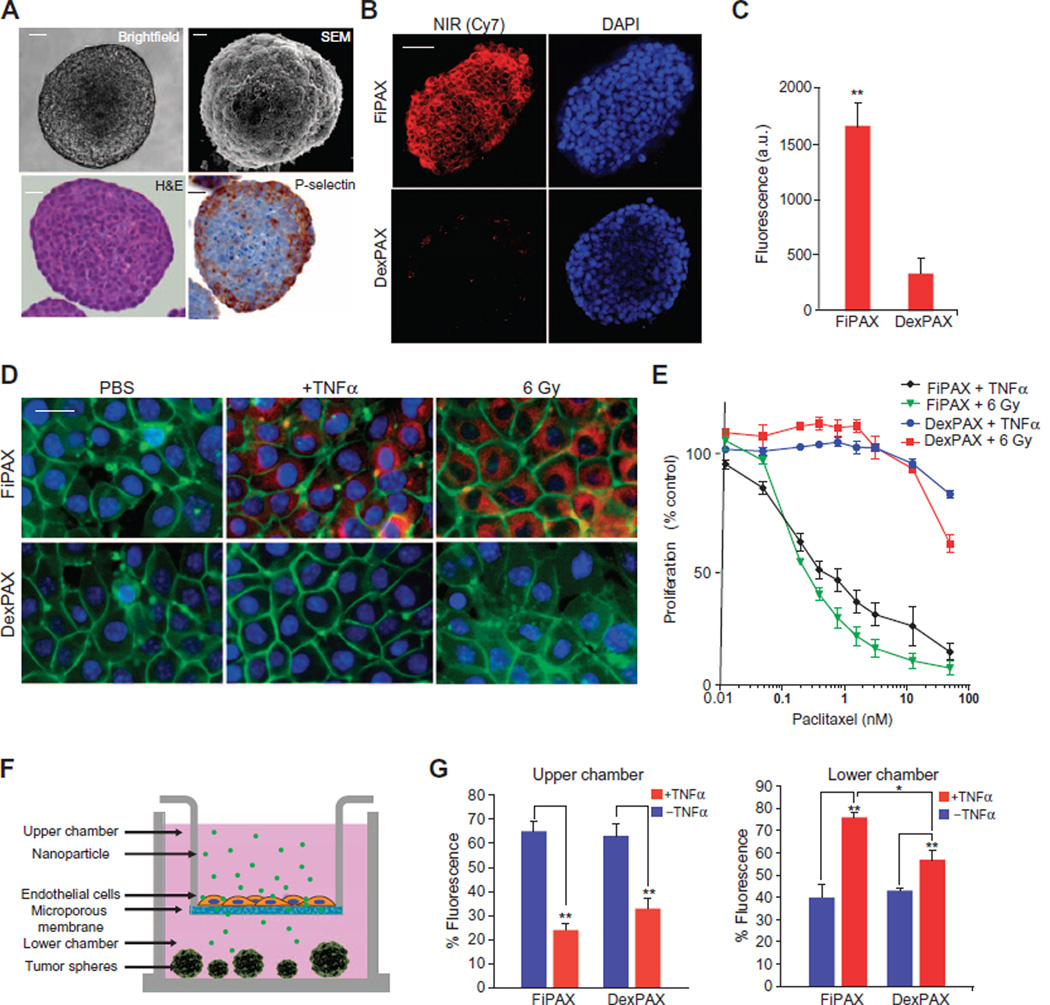
Fig. 2. In vitro studies of nanoparticle penetration of endothelium and tumor.
(A) Liver tumor spheroid model, SK-136, which constitutively expresses P-selectin at the surface. Top: Bright-field microscopy and SEM. Bottom: Hematoxylin and eosin (H&E) and IHC staining with a P-selectin antibody. Scale bars, 10 µm. (B) Fluorescence microscopy of NIR dye emission from nanoparticles in the tumor spheroids. Red, NIR fluorescence; blue, 4′,6-diamidino-2-phenylindole (DAPI) nuclear staining. Scale bar, 20 µm. (C) Quantification of nanoparticle emission in tumor spheres. Bars show means ± SD of n = 6 spheres; P = 0.0042. (D) Fluorescence images of human endothelial monolayer (EA.hy926) treated with TNFα and ionizing radiation (6 Gy) to induce P-selectin. Red, NIR dye in FiPAX or control DexPAX nanoparticles; green, CellMask membrane stain; blue, DAPI nuclear stain. Scale bar, 5 µm. (E) Nanopartide-mediated cytotoxicity of bEnd.3 cells activated by TNFα or 6 Gy, as measured by MTT (4,5-dimethylthiazol-2-yl)-2,5-diphenyltetrazolium bromide) cell viability assay. (F) Diagram of assay to test penetration of nanoparticles into an activated endothelial monolayer barrier and infiltration into non–P-selectin–expressing tumor spheroids, LX33, composed of primary human small cell lung cancer (SCLC) cells. (G) Targeted (FiPAX) and control (DexPAX) nanoparticle emission in the upper and lower chambers of a Transwell system. Plots show means ± SD (n = 4).

