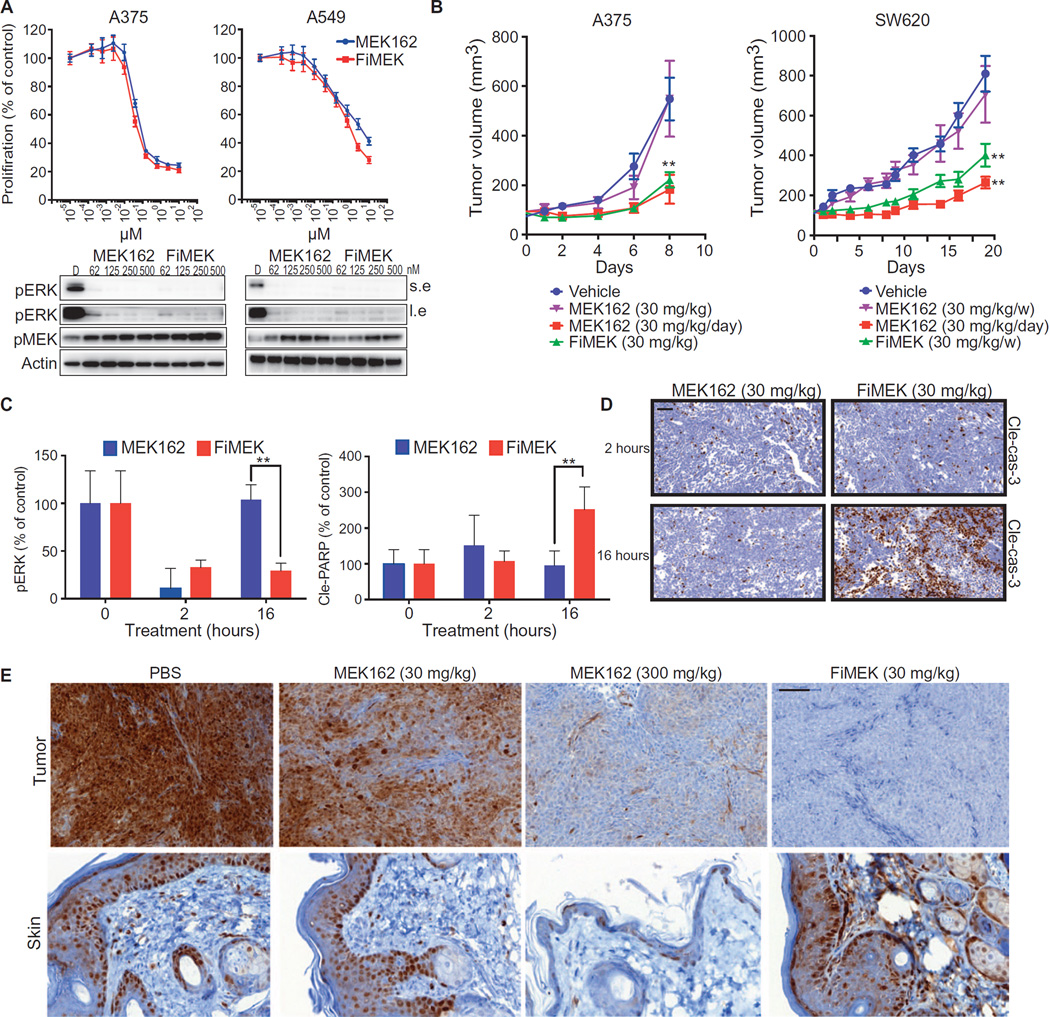
Fig. 5. P-selectin–targeted delivery of an inhibitor of the MEK/ERK pathway.
(A) Top: Proliferation of cell lines measured after 4 days of treatment with MEK162 or FiMEK as indicated. Bottom: Biochemical analysis of A375 and A549 cell lines treated for 4 hours with MEK162 or FiMEK. (B) Growth of tumor xenografts after a single dose of vehicle, MEK162, and FiMEK or a daily dose of MEK162. x axis represents days after first treatment; n = 6 per group. P(A375) = 0.0048, P(SW520,FiMEK) = 0.0071, P(SW520,MEK) = 0.0055. (C) Biochemical quantification (Western blot) of pERK and PARP cleavage in xenografts of A375 tumors treated for 2 or 16 hours with MEK162 or FiMEK. P = 0.0089 and 0.0053, respectively. (D) IHC of cleaved caspase 3 in HCT116 xenografts treated with MEK162 or FiMEK. Scale bar, 50 µm. (E) IHC of pERK in skin and tumors of HCT116 xenografts treated with MEK162 (30 and 300 mg/kg) or FiMEK (30 mg/kg) after 24 hours. Scale bar, 100 µm. Nanoparticle concentrations are listed in terms of the equivalent amount of encapsulated drug. Plots show means ± SD.

