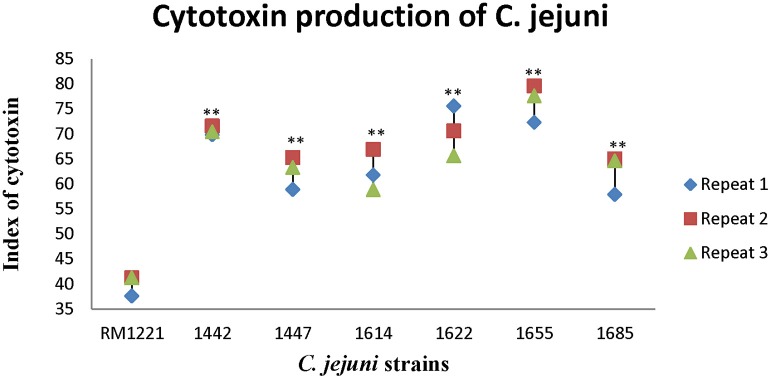
Figure 2.
Cytotoxic production of C. jejuni isolates in murine macrophage RAW264.7 cell. The Y-axis is the index of cytotoxic production of each strain. The results were obtained from three independent repeats. The asterisk (*) and (**) represent statistical significant difference with P ≤ 0.05 and P ≤ 0.01 comparing with C. jejuni RM1221, respectively.

