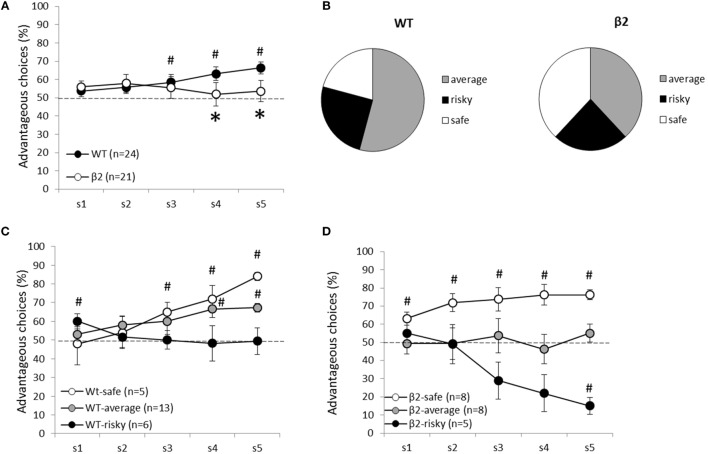
Figure 5.
Animal’s performances during the decision-making task (MGT) are expressed as mean ± SEM for WT and β2−/− mice. (A) Global performances of WT (n = 24) and β2−/− mice (n = 21) during the MGT. K-means clustering analysis divided each group of mice in three subgroups. Safe, average, and risky mice are represented in (C) for WT mice and (D) for β2−/− mice. (B) Subgroup repartition for each genotype. Significant (p < 0.05) difference from chance is represented as # and *represent significant (p < 0.05) genotype effect.

