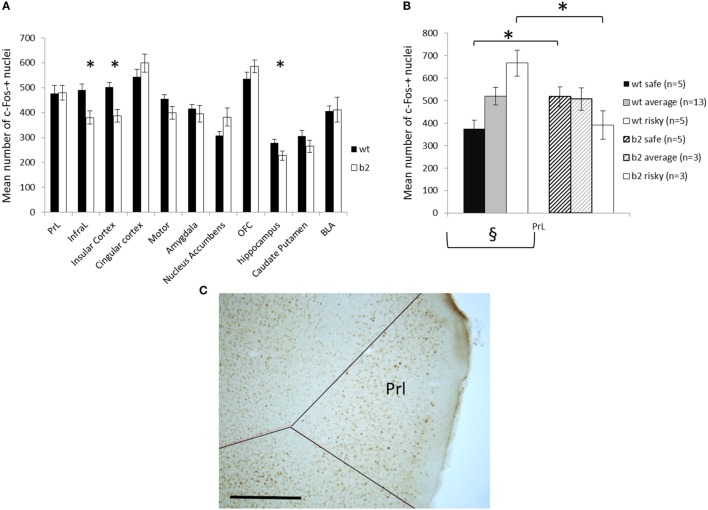
Figure 7.
Cfos expression following the mouse gambling task (MGT) expressed as mean ± SEM for WT and β2−/− mice. (A) cfos expression in the different brain areas. *genotype effect p < 0.05. (B) cfos expression in the prelimbic cortex in different subgroups of MGT performance (safe, average, and risky) in both WT and β2−/− mice. *genotype effect p < 0.05, § significant global subgroup effect in WT mice only. (C) Representative microphotography of c-Fos immunohistochemistry in the PrL, scale bar 500 μm.

