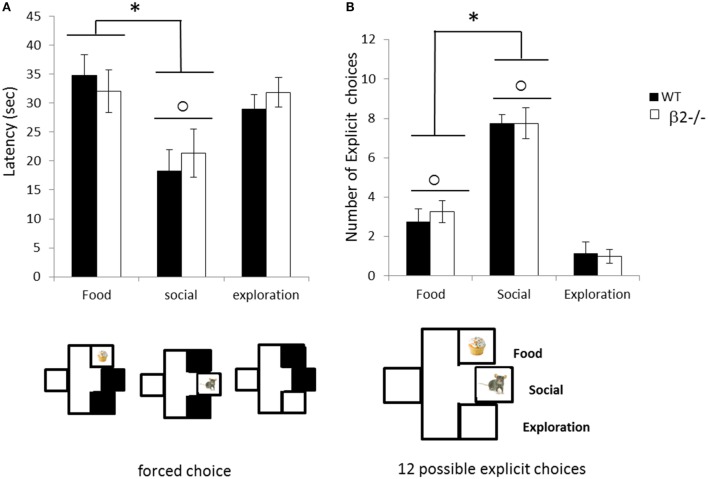
Figure 8.
Choice performance during the explicit choice task expressed as mean ± SEM for WT (black) and β2−/− mice (white). (A) Mean latency to reach each rewarded box during forced choice. (B) Mean number of food (F), social (S) or exploration (E) choice made by animals during the 12 explicit choices. *food vs. social p < 0.05, ○ social vs. exploration p < 0.05.

