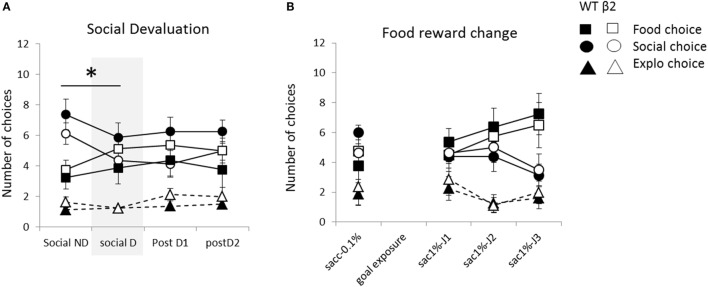
Figure 9.
Animal’s performances during the motivational modulation of explicit choice are expressed as mean ± SEM for WT and β2−/− mice. (A) Mean number of explicit food choice (square), social choice (circle), or exploration choice (triangle) over 12 daily trials. Successive days correspond to successive paradigms applied to all animals: non-devaluation of social reward (Social ND), devaluation of social reward (Social D) and Post D1 and D2 are classic days of 12 explicit choice trials. (B) Mean number of explicit food choice (square), social choice (circle), or exploration choice (triangle) over 12 daily trials. Successive days correspond to successive paradigms with increasing number and quality going from one drop of 0.1% saccharine to two drops of 1% saccharin from day sac1%-J1 to sac1%-J3. *p < 0.05. (β2−/− are in white and WT in black).

